OPEN-SOURCE SCRIPT
Money Flow Intensity

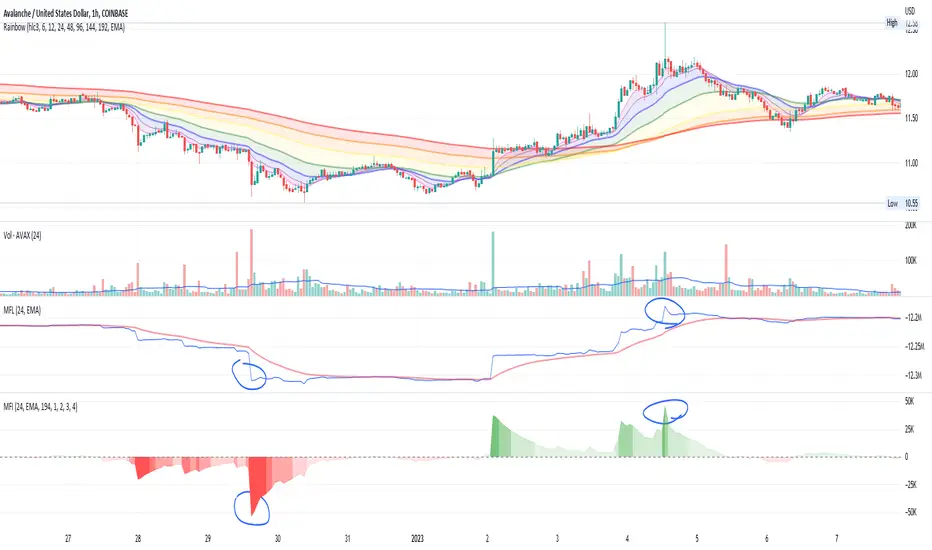
This indicator works very similarly to Elder's Force Index (EFI) and builds on top of what I have for the Money Flow Line (see my other scripts). It combines price movements with volume to create sort of "dollar flow" pressure up and down, looking for "smart money" ("big money") to make their move.
The indicator uses a lookback period to calculate a standard deviation of the movement intensity, then creates gradients to visualize how intense the movement is relative to other movements. This helps measure the pull away from the average more easily than with the Money Flow Line alone.
Much like with EFI, high intensity moves can indicate two things:
1. Strength and conviction in the current direction OR...
2. A reversal is coming soon
You can also watch for waning volume in the current direction, indicating that a trend is losing interest and may be due for a pullback.
There is no way to know, but combining this with price action and a trend indicator can help give you some good educated guesses about what could happen next. Combine with averaging in or out and managing risk appropriately. Good luck :)
오픈 소스 스크립트
트레이딩뷰의 진정한 정신에 따라, 이 스크립트의 작성자는 이를 오픈소스로 공개하여 트레이더들이 기능을 검토하고 검증할 수 있도록 했습니다. 작성자에게 찬사를 보냅니다! 이 코드는 무료로 사용할 수 있지만, 코드를 재게시하는 경우 하우스 룰이 적용된다는 점을 기억하세요.
면책사항
해당 정보와 게시물은 금융, 투자, 트레이딩 또는 기타 유형의 조언이나 권장 사항으로 간주되지 않으며, 트레이딩뷰에서 제공하거나 보증하는 것이 아닙니다. 자세한 내용은 이용 약관을 참조하세요.
오픈 소스 스크립트
트레이딩뷰의 진정한 정신에 따라, 이 스크립트의 작성자는 이를 오픈소스로 공개하여 트레이더들이 기능을 검토하고 검증할 수 있도록 했습니다. 작성자에게 찬사를 보냅니다! 이 코드는 무료로 사용할 수 있지만, 코드를 재게시하는 경우 하우스 룰이 적용된다는 점을 기억하세요.
면책사항
해당 정보와 게시물은 금융, 투자, 트레이딩 또는 기타 유형의 조언이나 권장 사항으로 간주되지 않으며, 트레이딩뷰에서 제공하거나 보증하는 것이 아닙니다. 자세한 내용은 이용 약관을 참조하세요.