INVITE-ONLY SCRIPT
업데이트됨 Orion Algo
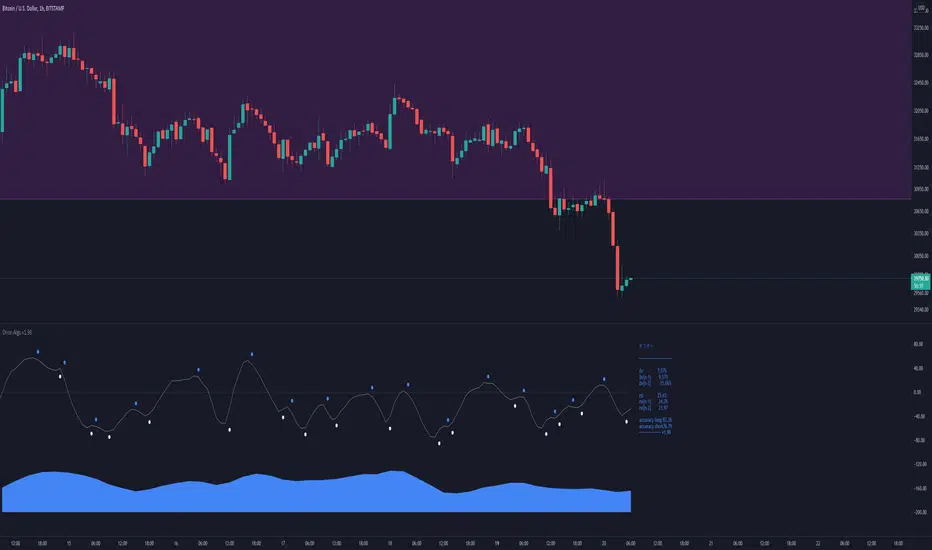
Orion Algo is a next-gen trading algorithm designed to help traders find the highs and lows of the market before, during, and after they happen. We wanted to give an indicator to people that was simple to use. In fact we created the algorithm in such a way that it currently only needs a single input from the user. Since no indicator can predict the market perfectly, Orion should be used as just another tool (although quite a sharp one) for you to trade with. Fundamental knowledge of price action and TA should be used with Orion Algo.
Being an oscillator, Orion currently has a bias towards market volatility. So you will want to be trading markets over 30% volatility. We have plans to develop future versions that take this into account and adjust automatically for dead conditions. Also, while there are some similarities across all oscillators, what sets ours apart is the prediction curve. The prediction curve looks at the current signal values and gives it a relative score to approximate tops and bottoms 1-2 bars ahead of the signal curve. We also designed a velocity curve that attempts to predict the signal curve 2+ bars ahead. You can find the relative change in velocity in the Info panel. The bottom momentum wave is based on the signal curve and helps find overall market direction of higher time-frames while in a lower one.
Future Roadmap:
Simple Strategy:
1. Start at a high time-frame to get an overview of the market you are wanting to enter. Daily is usually a good starting time.
2. If you can, add Orion to a second chart with a lower time-frame such as 4H.
3. Check the lower time frame to find potential medium term entry points based on where the trend was heading from the higher time-frame.
4. Step even lower to the 1H to find your optimal entry based on the higher times and technical analysis of the charts (support/resistance, patterns, etc)
5. The momentum wave can be used to find overall trend of the market. When it starts curving up, the market is bullish. When it curves down, the market could be bearish.
Intermediate Strategy:
1. Use simple strategy first.
2. Use the Prediction and ∆v curves to see future reversals in the works.
3. You can use these curves as potential entries as well as exit points.
4. Take into account potential divergence of the signal lines and price action.
Settings and How to Use them:
User Agreement – Orion Algo is a tool for you to use while trading. We aren’t responsible for losses OR the gains you make with it. By clicking the checkbox on the left you are agreeing to the terms.
Super Smooth – Smooths the main signal line based on the value inside the box. Lower values shift the pivot points to the left but also make things more noisy. Higher values move things to the right making it lag a bit more while creating a smoother signal. 8 is a good value to start with.
Theme – Changes the color scheme of Orion.
Info – Turns on a dashboard with useful stats, such as Delta v, Volatility, Rsi, etc. Changing the value box will move the dashboard left and right.
Pivots – Toggles main bull/bear dots.
Prediction – A secondary prediction model that attempts to predict a reversal before it happens (0-2bars). This can be noisy some times so make your best judgement. Curve will toggle a curve view of the prediction. Pivots will toggle bull/bear dots.
∆v – Delta v (change in velocity). This shows momentum of the signal. Crossing 0 signals a reversal. If you see the delta v changing direction, it may signify a reversal in the several bars depending on the overall momentum of the market.
Divergence – Toggles divergence lines. Hidden will show hidden divergences. Cross will show divergences that cross the 0 line.
Momentum Wave – Uses the signal as a macro trend indicator. Changes in direction of the wave can signify macro changes in the market. Average will toggle an averaging algorithm of the momentum waves and makes it easy to understand.
OBOS – Overbought/Oversold lines. Dyn will convert them to dynamic OBOS lines. The value box will adjust the smoothing.
Being an oscillator, Orion currently has a bias towards market volatility. So you will want to be trading markets over 30% volatility. We have plans to develop future versions that take this into account and adjust automatically for dead conditions. Also, while there are some similarities across all oscillators, what sets ours apart is the prediction curve. The prediction curve looks at the current signal values and gives it a relative score to approximate tops and bottoms 1-2 bars ahead of the signal curve. We also designed a velocity curve that attempts to predict the signal curve 2+ bars ahead. You can find the relative change in velocity in the Info panel. The bottom momentum wave is based on the signal curve and helps find overall market direction of higher time-frames while in a lower one.
Future Roadmap:
- Create secondary on-bar indicator to pair with Orion Algo
- Automatically adjust internal variables based on market volatility
- Indicator style selection
Simple Strategy:
1. Start at a high time-frame to get an overview of the market you are wanting to enter. Daily is usually a good starting time.
2. If you can, add Orion to a second chart with a lower time-frame such as 4H.
3. Check the lower time frame to find potential medium term entry points based on where the trend was heading from the higher time-frame.
4. Step even lower to the 1H to find your optimal entry based on the higher times and technical analysis of the charts (support/resistance, patterns, etc)
5. The momentum wave can be used to find overall trend of the market. When it starts curving up, the market is bullish. When it curves down, the market could be bearish.
Intermediate Strategy:
1. Use simple strategy first.
2. Use the Prediction and ∆v curves to see future reversals in the works.
3. You can use these curves as potential entries as well as exit points.
4. Take into account potential divergence of the signal lines and price action.
Settings and How to Use them:
User Agreement – Orion Algo is a tool for you to use while trading. We aren’t responsible for losses OR the gains you make with it. By clicking the checkbox on the left you are agreeing to the terms.
Super Smooth – Smooths the main signal line based on the value inside the box. Lower values shift the pivot points to the left but also make things more noisy. Higher values move things to the right making it lag a bit more while creating a smoother signal. 8 is a good value to start with.
Theme – Changes the color scheme of Orion.
Info – Turns on a dashboard with useful stats, such as Delta v, Volatility, Rsi, etc. Changing the value box will move the dashboard left and right.
Pivots – Toggles main bull/bear dots.
Prediction – A secondary prediction model that attempts to predict a reversal before it happens (0-2bars). This can be noisy some times so make your best judgement. Curve will toggle a curve view of the prediction. Pivots will toggle bull/bear dots.
∆v – Delta v (change in velocity). This shows momentum of the signal. Crossing 0 signals a reversal. If you see the delta v changing direction, it may signify a reversal in the several bars depending on the overall momentum of the market.
Divergence – Toggles divergence lines. Hidden will show hidden divergences. Cross will show divergences that cross the 0 line.
Momentum Wave – Uses the signal as a macro trend indicator. Changes in direction of the wave can signify macro changes in the market. Average will toggle an averaging algorithm of the momentum waves and makes it easy to understand.
OBOS – Overbought/Oversold lines. Dyn will convert them to dynamic OBOS lines. The value box will adjust the smoothing.
릴리즈 노트
Updated to v1.91Indicator Updates:
Fixed major data loss issue. Now the indicator should draw even on high times with less than a year of data!
Added prediction curve bias! Now you can push the predictions earlier or later. 0.5-0.7 is usually safe. Lower than that could show more false positives.
릴리즈 노트
Pushing some fixes and removing some things until they are finished:Major - Added max_bars_back function. Some coin pairs and timeframes would throw errors. Hopefully this fixes it.
Removed donation addresses. This makes the indicator title messy for people that haven't turned off arguments in the chart settings.
Disabled momentum wave until I design some new math for it. Currently it's confusing users.
Cleaned up style tab.
릴리즈 노트
Updated to v1.94Indicator Updates:
Fix plot names. Now they can be used as source variables.
Added another range to delta v and rsi in the dashboard to show the direction easier.
Cleaned up code.
Created gradient function for use later.
Website Updates:
Roadmap has new cards and suggestions to look into : Trello
Indicator Updates:
Momentum Wave Rework - Designed a new momentum wave indicator. This should help keep you in trades longer. Find an entry when the momentum wave starts to go up, exit when it goes down.
Momentum Wave Options - You can smooth the wave for longer position holding and adjust the visuals from curve to step as well as the position.
Other Updates:
Made a Discord
Next Up:
Light/Dark Mode
PDF Book on how to use Orion as well as some strategies.
릴리즈 노트
Quick Fix:Indicator:
emotion - There was a bug when calculating the emotion. This has been fixed now.
릴리즈 노트
Quick FixIndicator Updates:
emotion - fixed a bug that was causing the emotion to stay neutral.
릴리즈 노트
Updated to 1.97Indicator Updates:
Theme>Custom - Users can now use their own custom colors.
Backend fixes.
Make sure to remove Orion and re-add it to your chart to see the latest updates.
릴리즈 노트
Whoops. Forgot to remove a variable from the dashboard.릴리즈 노트
Release Notes: Updated to 1.98Indicator Updates:
Refined the main signal. Now it should be a lot more accurate on every time frame.
Performance boost! No more waiting around for things to load.
Removed A BUNCH of unnecessary junk. Trying to make this indicator more minimal to prepare for v2.
Make sure to remove Orion and re-add it to your chart to see the latest updates.
초대 전용 스크립트
이 스크립트는 작성자가 승인한 사용자만 접근할 수 있습니다. 사용하려면 요청 후 승인을 받아야 하며, 일반적으로 결제 후에 허가가 부여됩니다. 자세한 내용은 아래 작성자의 안내를 따르거나 OrionAlgo에게 직접 문의하세요.
트레이딩뷰는 스크립트의 작동 방식을 충분히 이해하고 작성자를 완전히 신뢰하지 않는 이상, 해당 스크립트에 비용을 지불하거나 사용하는 것을 권장하지 않습니다. 커뮤니티 스크립트에서 무료 오픈소스 대안을 찾아보실 수도 있습니다.
작성자 지시 사항
Please go to: https://orionalgo.com to get a free 7 day trial. Allow 5-10 Minutes for Orion Algo to be added to your invite-only scripts. If you don't see it, please PM us.
면책사항
해당 정보와 게시물은 금융, 투자, 트레이딩 또는 기타 유형의 조언이나 권장 사항으로 간주되지 않으며, 트레이딩뷰에서 제공하거나 보증하는 것이 아닙니다. 자세한 내용은 이용 약관을 참조하세요.