INVITE-ONLY SCRIPT
업데이트됨 Banknifty-Direction-Bank-Stocks
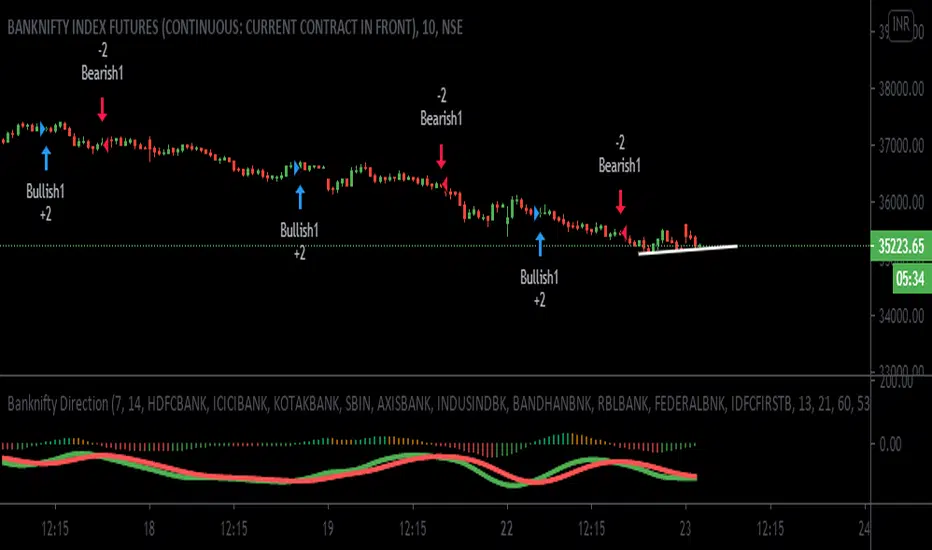
Banknifty Direction Bank Stocks is indicator to give Banknifty future direction.
This Indicator is giving signal by taking 11 Major Indian Bank trend into consideration.
This indicator is giving two signal Bullish and Bearish .
Bullish signal can be used for long Banknifty and Bearish signal can be used to close existing Banknifty position and make new short side position and again when Bullish signal come then close existing short position and take new long position and so on.
There is zone area green zone and red zone and central line. Green zone is Bullish area and Red zone is Bearish area.
When ever green line cross over red line then Bullish signal generated and when ever green line cross under red line Bearish Signal generated.
Strong Bullish when Crossover is happening above central line and Strong Bearish when Cross under is happening below central line.
Many Thanks to LazyBear main author, I have used his wave trend function and modified that as per Banknifty index so that we can get better result.
User must keep the default setting for getting better results as results are back tested. If setting changed then result may vary.
I have added here back tested performance user can see those results. I have added commission and slippage as well.
This indicator is available on Subscription.
PM/DM for more information about the script access.
Use the link below to obtain access to this indicator
릴리즈 노트
Source Code changed to Version 4 and Bar color added. and Minor Fix.릴리즈 노트
Updated Histogram color calculation and removed background color.Added Slippage and commission on calculation of profit.
Signal is working with 1m ,3m, 5m, 15m ,30m time frame. higher time frame results are not good.
릴리즈 노트
Updated code for making profitable 1m , 3m lower time frame.릴리즈 노트
Updated the code for two new cross over with existing line cross over. From all three any one should be enabled and check the result in Strategy Tester.Newly added below.
1) HMA crossover SMMA
2) SMMA 7 crossover SMMA 14
릴리즈 노트
Three different kind of line plot added based on ON and OFF crossover from settings.릴리즈 노트
Modified the code for latest bank inclusion like Bandhan Bank Ltd and exclusion of Yes Bank Ltd.Change the algo to improve the performance.
릴리즈 노트
With this update I have removed BankofBaroda and Include IDFCFIRSTB as this changes latest came from NSE and i have updated their latest weight on banknifty.릴리즈 노트
updated existing performance and added ATR for trade direction to improve the performance of indicator.With ATR I am finding the trend of existing time frame candles and based on that what ever trades are there that I am filtering . Improved the performance from 25% to 300% almost but if u are trading all the signals.
초대 전용 스크립트
이 스크립트는 작성자가 승인한 사용자만 접근할 수 있습니다. 사용하려면 요청 후 승인을 받아야 하며, 일반적으로 결제 후에 허가가 부여됩니다. 자세한 내용은 아래 작성자의 안내를 따르거나 bullsbearsclub에게 직접 문의하세요.
트레이딩뷰는 스크립트의 작동 방식을 충분히 이해하고 작성자를 완전히 신뢰하지 않는 이상, 해당 스크립트에 비용을 지불하거나 사용하는 것을 권장하지 않습니다. 커뮤니티 스크립트에서 무료 오픈소스 대안을 찾아보실 수도 있습니다.
작성자 지시 사항
I shall recommend to use only 5 minute chart and trade all the signals at least 10 signals and do the paper work and see how it works for you .
Join my Educational Telegram channel:
t.me/bullsbearsclub
My YouTube channel: youtube.com/channel/UC537A
My Indicator details:
docs.google.com/document/d/17wUSbSJEZR6rTNVdwqLEBaKM-CSYx-61TN0qazvsnAQ/edit?usp=sharing
t.me/bullsbearsclub
My YouTube channel: youtube.com/channel/UC537A
My Indicator details:
docs.google.com/document/d/17wUSbSJEZR6rTNVdwqLEBaKM-CSYx-61TN0qazvsnAQ/edit?usp=sharing
면책사항
해당 정보와 게시물은 금융, 투자, 트레이딩 또는 기타 유형의 조언이나 권장 사항으로 간주되지 않으며, 트레이딩뷰에서 제공하거나 보증하는 것이 아닙니다. 자세한 내용은 이용 약관을 참조하세요.