INVITE-ONLY SCRIPT
업데이트됨 Portfolio Manager
Meet our all-new Portfolio Manager
The idea of such a tool was the lack of anything like that out there. Recently I've seen that the culture most common around the newcomers to trading has become extraordinarily scalping-like and much leaned on high-risk operations.
Fundamental cornerstones of math and statistics that are keys to lasting networth growth have been wholly forgotten.
One of the most efficient and simple ways that I tell my friends to make money without getting too technical is diversification.
It's merely math; I suggest reading about the Modern Portfolio Theory, based on the work about diversification of uncorrelated assets by Markowitz(Nobel-winner because of that).
Translating it to mere humans, the more assets you have, the more uncorrelated they are(as in their pattern of moves are nothing alike), the fewer risks of losing money in a given time you have.
So by following such stats, it's clear to say that's always important to trade on different fronts.
To quantify and qualify who diversified you are and how much risk you're taking, we decided to create a pretty handy tool.
Let's get the samba going:
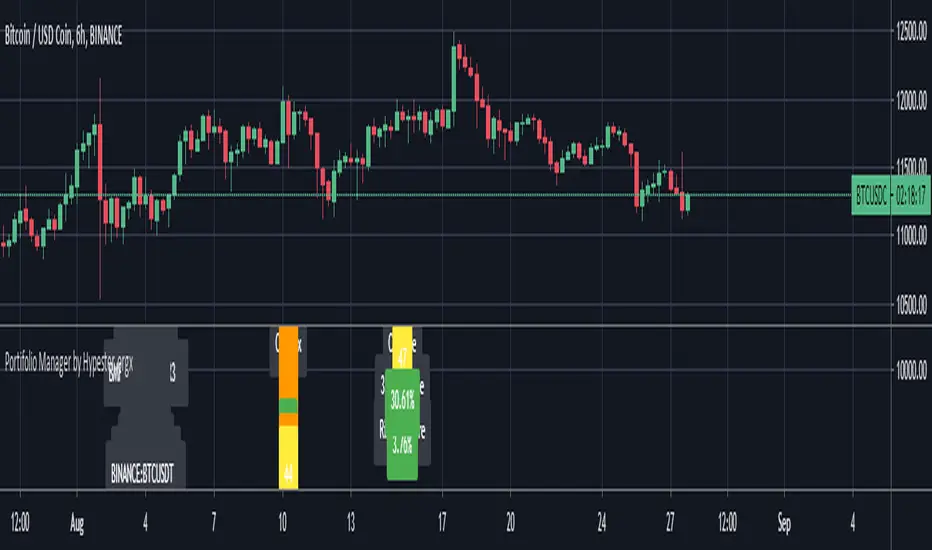
C-Index is the individual correlation score of that asset compared to the given portfolio correlation average.
C-Score is the final correlation score of your portfolio.
Below that, we got the performance tracker, whatever timeframe you're benchmarking your portfolio, it will show there. I like to back-test for one year.
And last but not least, we have a proprietary risk exposure gauge, so we run a few math tricks, and we calculate how was the maximum of your investment that was exposed through-out the time range we set in. So let's say we have a 10% risk exposure over 365 days. It means that over one year at maximum we could have lost 10% of our investment.
If you're not familiar with correlation:
-> +100 score = Fully Correlated(Similar Behaviors)
-> 0 Score = Totally Uncorrelated(Different Behaviors)
-> -100 score = Inversely Correlated(Opposite Behaviors)
So any asset that averages between -20 and 20 is very little correlated to its comparison. Therefore, their pattern of behavior tend to be independent
By comparing the change and the risk exposure, you can assess your risk/reward ratio - golden information.
Not only that, but we also added several markets so you can easily benchmark your portfolio(up to 9 custom assets) to a diversified gamma of markets in the world.
We diversified each benchmark portfolio within its available industries for maximum risk mitigation.
You can change your benchmark range, nine custom assets, labels preferences, and nine benchmark portfolios, including NIKKEI, NASDAQ, IBOV , ASX , DAX , CRYPTO, FOREX, FTSE , SHANGHAI.
If you liked what you see take a look at our signare to get access to our scripts!
The idea of such a tool was the lack of anything like that out there. Recently I've seen that the culture most common around the newcomers to trading has become extraordinarily scalping-like and much leaned on high-risk operations.
Fundamental cornerstones of math and statistics that are keys to lasting networth growth have been wholly forgotten.
One of the most efficient and simple ways that I tell my friends to make money without getting too technical is diversification.
It's merely math; I suggest reading about the Modern Portfolio Theory, based on the work about diversification of uncorrelated assets by Markowitz(Nobel-winner because of that).
Translating it to mere humans, the more assets you have, the more uncorrelated they are(as in their pattern of moves are nothing alike), the fewer risks of losing money in a given time you have.
So by following such stats, it's clear to say that's always important to trade on different fronts.
To quantify and qualify who diversified you are and how much risk you're taking, we decided to create a pretty handy tool.
Let's get the samba going:
C-Index is the individual correlation score of that asset compared to the given portfolio correlation average.
C-Score is the final correlation score of your portfolio.
Below that, we got the performance tracker, whatever timeframe you're benchmarking your portfolio, it will show there. I like to back-test for one year.
And last but not least, we have a proprietary risk exposure gauge, so we run a few math tricks, and we calculate how was the maximum of your investment that was exposed through-out the time range we set in. So let's say we have a 10% risk exposure over 365 days. It means that over one year at maximum we could have lost 10% of our investment.
If you're not familiar with correlation:
-> +100 score = Fully Correlated(Similar Behaviors)
-> 0 Score = Totally Uncorrelated(Different Behaviors)
-> -100 score = Inversely Correlated(Opposite Behaviors)
So any asset that averages between -20 and 20 is very little correlated to its comparison. Therefore, their pattern of behavior tend to be independent
By comparing the change and the risk exposure, you can assess your risk/reward ratio - golden information.
Not only that, but we also added several markets so you can easily benchmark your portfolio(up to 9 custom assets) to a diversified gamma of markets in the world.
We diversified each benchmark portfolio within its available industries for maximum risk mitigation.
You can change your benchmark range, nine custom assets, labels preferences, and nine benchmark portfolios, including NIKKEI, NASDAQ, IBOV , ASX , DAX , CRYPTO, FOREX, FTSE , SHANGHAI.
If you liked what you see take a look at our signare to get access to our scripts!
릴리즈 노트
Critical Update: Older Version Was Posted Previously초대 전용 스크립트
이 스크립트는 작성자가 승인한 사용자만 접근할 수 있습니다. 사용하려면 요청 후 승인을 받아야 하며, 일반적으로 결제 후에 허가가 부여됩니다. 자세한 내용은 아래 작성자의 안내를 따르거나 spectertrading에게 직접 문의하세요.
트레이딩뷰는 스크립트의 작동 방식을 충분히 이해하고 작성자를 완전히 신뢰하지 않는 이상, 해당 스크립트에 비용을 지불하거나 사용하는 것을 권장하지 않습니다. 커뮤니티 스크립트에서 무료 오픈소스 대안을 찾아보실 수도 있습니다.
작성자 지시 사항
면책사항
해당 정보와 게시물은 금융, 투자, 트레이딩 또는 기타 유형의 조언이나 권장 사항으로 간주되지 않으며, 트레이딩뷰에서 제공하거나 보증하는 것이 아닙니다. 자세한 내용은 이용 약관을 참조하세요.
초대 전용 스크립트
이 스크립트는 작성자가 승인한 사용자만 접근할 수 있습니다. 사용하려면 요청 후 승인을 받아야 하며, 일반적으로 결제 후에 허가가 부여됩니다. 자세한 내용은 아래 작성자의 안내를 따르거나 spectertrading에게 직접 문의하세요.
트레이딩뷰는 스크립트의 작동 방식을 충분히 이해하고 작성자를 완전히 신뢰하지 않는 이상, 해당 스크립트에 비용을 지불하거나 사용하는 것을 권장하지 않습니다. 커뮤니티 스크립트에서 무료 오픈소스 대안을 찾아보실 수도 있습니다.
작성자 지시 사항
면책사항
해당 정보와 게시물은 금융, 투자, 트레이딩 또는 기타 유형의 조언이나 권장 사항으로 간주되지 않으며, 트레이딩뷰에서 제공하거나 보증하는 것이 아닙니다. 자세한 내용은 이용 약관을 참조하세요.