OPEN-SOURCE SCRIPT
업데이트됨 Rational MTF Auto - Fibonacci Retracement Levels
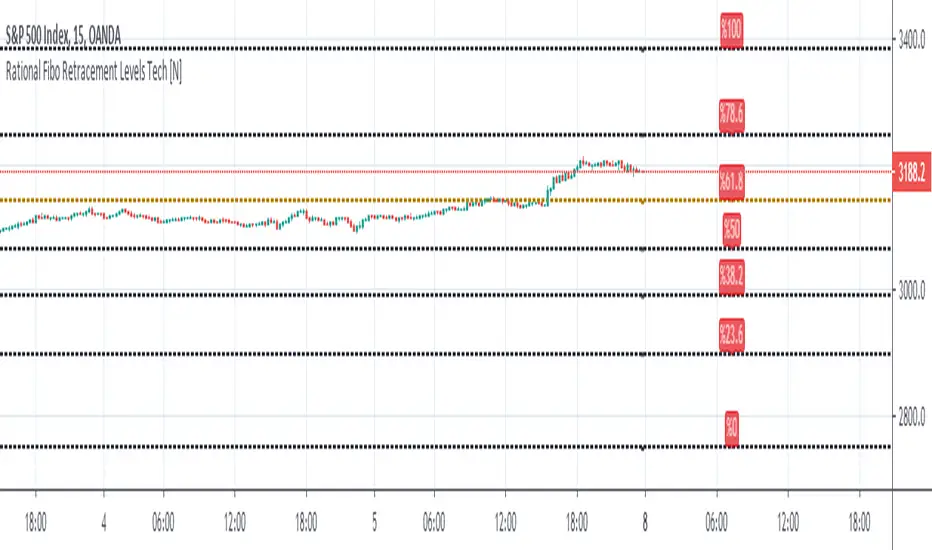
Hello, this script automatically draws rational Support - Resistance Levels as multi time frame. (MTF)
In this way, we see reasonable levels ahead of us.
As of the date of birth: The first year after Lehmann Brother's fall was determined after January 1, 2009.
One feature of this script (which I deliberately left this way) :
If the security and support-resistance levels are equal, it will show you NA value and say wait.
Because it is based on a weekly basis for region selection, I think that it should enter a region and support-resistance levels should be drawn accordingly.
That's why I left it this way.
NOTE :
This script was inspired by the following publication :

Regards.
In this way, we see reasonable levels ahead of us.
As of the date of birth: The first year after Lehmann Brother's fall was determined after January 1, 2009.
One feature of this script (which I deliberately left this way) :
If the security and support-resistance levels are equal, it will show you NA value and say wait.
Because it is based on a weekly basis for region selection, I think that it should enter a region and support-resistance levels should be drawn accordingly.
That's why I left it this way.
NOTE :
This script was inspired by the following publication :
Regards.
릴리즈 노트
Unnecessary codes cleared.릴리즈 노트
Repaint issue resolved. Many thanks to PineCoders for help.
오픈 소스 스크립트
트레이딩뷰의 진정한 정신에 따라, 이 스크립트의 작성자는 이를 오픈소스로 공개하여 트레이더들이 기능을 검토하고 검증할 수 있도록 했습니다. 작성자에게 찬사를 보냅니다! 이 코드는 무료로 사용할 수 있지만, 코드를 재게시하는 경우 하우스 룰이 적용된다는 점을 기억하세요.
Signals will be broadcast openly for a reasonable period.
Let's watch the algorithm's movements together from my website !
bit.ly/4j4sANJ
Email : contact@noldoresearch.com
Let's watch the algorithm's movements together from my website !
bit.ly/4j4sANJ
Email : contact@noldoresearch.com
면책사항
해당 정보와 게시물은 금융, 투자, 트레이딩 또는 기타 유형의 조언이나 권장 사항으로 간주되지 않으며, 트레이딩뷰에서 제공하거나 보증하는 것이 아닙니다. 자세한 내용은 이용 약관을 참조하세요.