PROTECTED SOURCE SCRIPT
TEDong OBV MACD OSC ==> Profit
Hi, Folg,
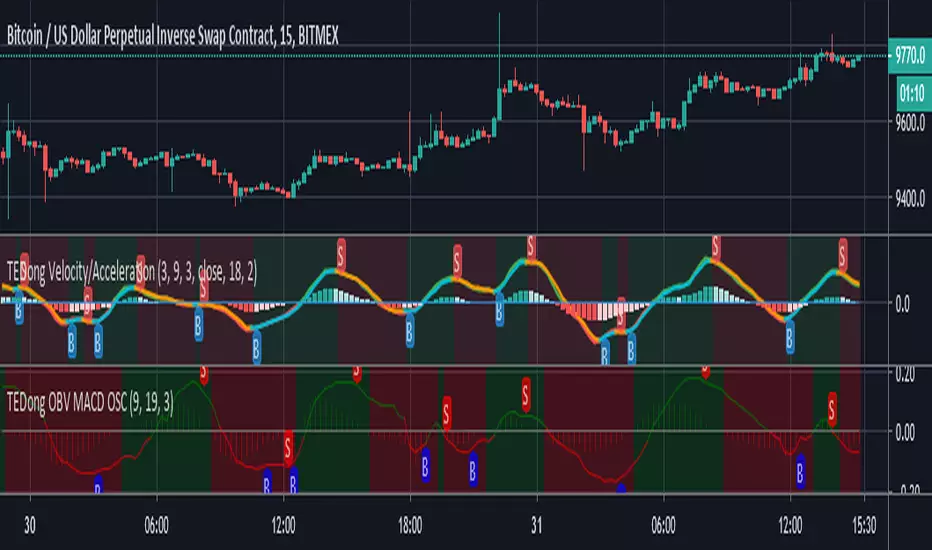
OBV MACD OSC gives a Buy signal when the OBV value crosses up its EMA and a Sell signal when it crosses down its EMA.
Cross over markers Directional bgcolor, where RED for bearish (S) and GREEN for bullish (B)
If you include volume analyses in your trading strategy, automating OBV MACD OSC will give buy signals whenever volume and price are rising altogether.
DONATE/TIP
BTC: 13nhMN2H4LoRi4VMcPcyR96jitxrH3uivB
보호된 스크립트입니다
이 스크립트는 비공개 소스로 게시됩니다. 하지만 이를 자유롭게 제한 없이 사용할 수 있습니다 – 자세한 내용은 여기에서 확인하세요.
면책사항
해당 정보와 게시물은 금융, 투자, 트레이딩 또는 기타 유형의 조언이나 권장 사항으로 간주되지 않으며, 트레이딩뷰에서 제공하거나 보증하는 것이 아닙니다. 자세한 내용은 이용 약관을 참조하세요.
면책사항
해당 정보와 게시물은 금융, 투자, 트레이딩 또는 기타 유형의 조언이나 권장 사항으로 간주되지 않으며, 트레이딩뷰에서 제공하거나 보증하는 것이 아닙니다. 자세한 내용은 이용 약관을 참조하세요.