PROTECTED SOURCE SCRIPT
Candles, average accumulation CTE

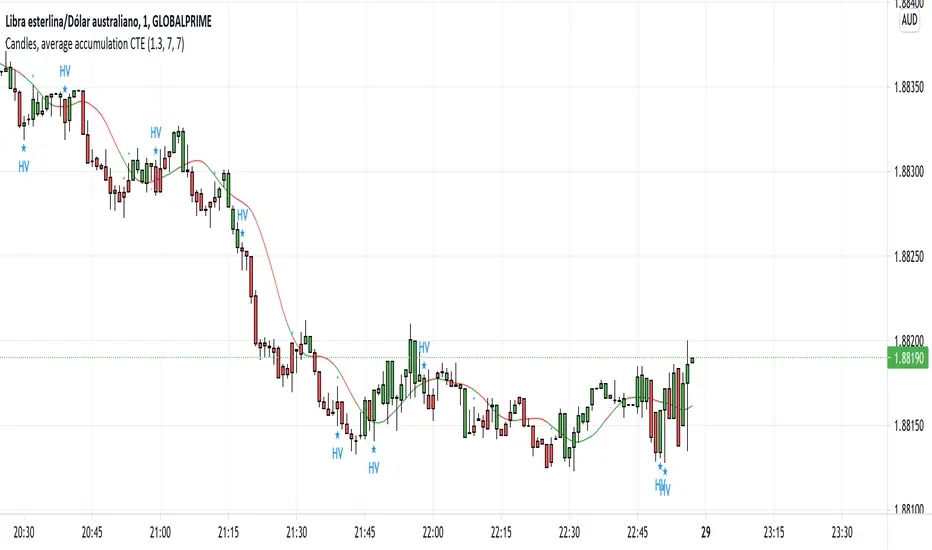
Hello everyone, this indicator is made to calculate the historical average cumulative volume, in the number configurable by the trader.
It is used to display bullish or bearish color in relation to the accumulation of historical volumes.
In the settings of the same indicator you can read the recommendations.
This indicator has 4 relevant data
1- Average accumulated volume, configurable by color
2- It shows us the climatic volume, based on the considerable and configurable increase in volume, in relation to the volume of the nearby candles.
3- It shows us a smoothed moving average, acting as support or dynamic resistance, this moving average should be used as a complement for the volume analysis, for example, if the color of the last candle appears in a negative accumulation color then we must wait that has force in movement with the crossing of the moving average.
In addition, this moving average is being used to perform anticipation calculations, based on short-term average accumulations of volume.
4- Anticipation calculations, the indicator shows us signs of "+" or "-" if the result of the early accumulation is being supported by climatic volume and in the same direction as the candle.
I hope this indicator is very useful so that you can keep in mind a relevant data such as the volume and the ease of visualization in space and time of the graph.
보호된 스크립트입니다
이 스크립트는 비공개 소스로 게시됩니다. 하지만 이를 자유롭게 제한 없이 사용할 수 있습니다 – 자세한 내용은 여기에서 확인하세요.
면책사항
해당 정보와 게시물은 금융, 투자, 트레이딩 또는 기타 유형의 조언이나 권장 사항으로 간주되지 않으며, 트레이딩뷰에서 제공하거나 보증하는 것이 아닙니다. 자세한 내용은 이용 약관을 참조하세요.
보호된 스크립트입니다
이 스크립트는 비공개 소스로 게시됩니다. 하지만 이를 자유롭게 제한 없이 사용할 수 있습니다 – 자세한 내용은 여기에서 확인하세요.
면책사항
해당 정보와 게시물은 금융, 투자, 트레이딩 또는 기타 유형의 조언이나 권장 사항으로 간주되지 않으며, 트레이딩뷰에서 제공하거나 보증하는 것이 아닙니다. 자세한 내용은 이용 약관을 참조하세요.