PROTECTED SOURCE SCRIPT
RSI Divergence
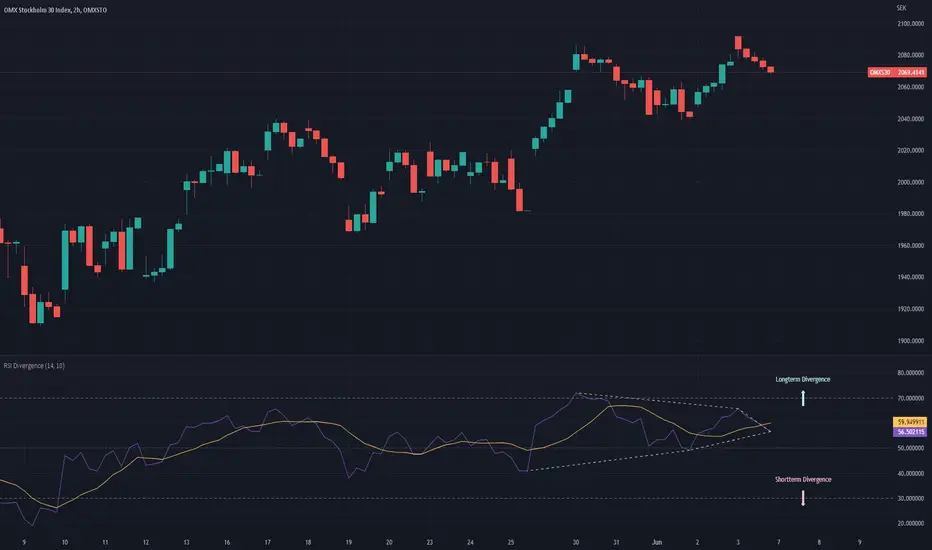
The RSI DIvergence script tries to predict the upper and lower trend-lines for the current security’s RSI.
The script identifies peaks and valleys within the RSI and then tries to draw a trend-line in between the peaks and the valleys. The longest possible trend-line originating from the latest peak/valley will be used to determine whether or not the trend is moving up or down, the slope of the trend-line will then dictate the direction of the trend.
(If no trend line can be drawn from the latest peak/valley, the current value of the RSI will be used as the origin point of the trend-line)
Once the script has identified the trendlines they will be superimposed on the RSI line as dashed lines. The color of the dashed lines will depend on the direction of the trend, an upwards moving trend will be depicted in green,whilst a downwards moving trend will be depicted in red.
Furthermore, the script will draw two arrows, representing the short term trend and the long term trend, as to make it even more clear which direction the two trend-lines have.
If only one trend-line (either upper or lower) can be found, the script will replace the corresponding arrow with a diamond shape instead.
보호된 스크립트입니다
이 스크립트는 비공개 소스로 게시됩니다. 하지만 이를 자유롭게 제한 없이 사용할 수 있습니다 – 자세한 내용은 여기에서 확인하세요.
면책사항
해당 정보와 게시물은 금융, 투자, 트레이딩 또는 기타 유형의 조언이나 권장 사항으로 간주되지 않으며, 트레이딩뷰에서 제공하거나 보증하는 것이 아닙니다. 자세한 내용은 이용 약관을 참조하세요.
보호된 스크립트입니다
이 스크립트는 비공개 소스로 게시됩니다. 하지만 이를 자유롭게 제한 없이 사용할 수 있습니다 – 자세한 내용은 여기에서 확인하세요.
면책사항
해당 정보와 게시물은 금융, 투자, 트레이딩 또는 기타 유형의 조언이나 권장 사항으로 간주되지 않으며, 트레이딩뷰에서 제공하거나 보증하는 것이 아닙니다. 자세한 내용은 이용 약관을 참조하세요.