PROTECTED SOURCE SCRIPT
업데이트됨 MarCipher | Buy/sell signals including VWAP, RSI and Stoch RSI.
//Based on many different scripts
The script can be used on every timeframe.
How to use it?
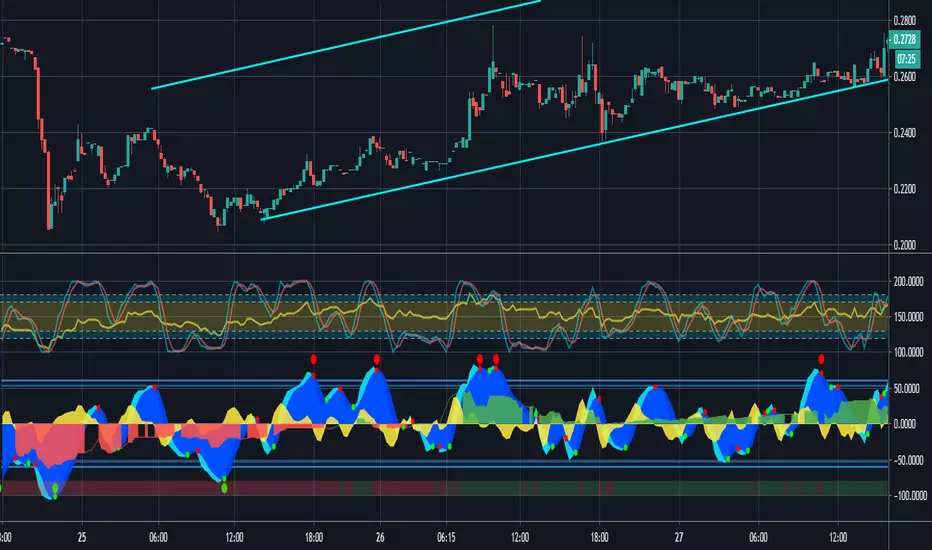
- First check whether the bar (below the waves) is green (which means there is a lot of buying recently), in that case we are looking for a long option. If it is red (ofcourse) we are looking for a short option.
- The green dots below the blue waves represent a buy signal and if the blue wave is oversold (below 60) the green dot is considered a BIG buy signal (more probability of a good trade). The big buy signals are also plotted on the horizontal bar. So a green dot on the bar while the bar is also green represents a buy signal. You can exit the long when a red dot appears in the blue wave above the zero line.
- Another way to use it is to look for divergence of the blue waves. When a blue wave below the zero line appears and then a new wave (some time later) appears which is smaller than the previous, this is considered a good entry point for a long.
- The yellow represents the VWAP (which can be used as a confirmation (crossing up means buying, crossing down means selling)
The RSI is also added (yellow line) oscillating between 100 and 200 (is moved up by 100).
The Stoch RSI is also added (blue and red lines) on the same interval as the RSI.
For improvements, ideas or questions, please don't hesitate to leave a message.
The script can be used on every timeframe.
How to use it?
- First check whether the bar (below the waves) is green (which means there is a lot of buying recently), in that case we are looking for a long option. If it is red (ofcourse) we are looking for a short option.
- The green dots below the blue waves represent a buy signal and if the blue wave is oversold (below 60) the green dot is considered a BIG buy signal (more probability of a good trade). The big buy signals are also plotted on the horizontal bar. So a green dot on the bar while the bar is also green represents a buy signal. You can exit the long when a red dot appears in the blue wave above the zero line.
- Another way to use it is to look for divergence of the blue waves. When a blue wave below the zero line appears and then a new wave (some time later) appears which is smaller than the previous, this is considered a good entry point for a long.
- The yellow represents the VWAP (which can be used as a confirmation (crossing up means buying, crossing down means selling)
The RSI is also added (yellow line) oscillating between 100 and 200 (is moved up by 100).
The Stoch RSI is also added (blue and red lines) on the same interval as the RSI.
For improvements, ideas or questions, please don't hesitate to leave a message.
릴리즈 노트
You can now manually create an alert for the big buy signals (big green dots)릴리즈 노트
//Updated to Pine Script version 5//Based on many different scripts
The script can be used on every timeframe.
How to use it?
- First check whether the bar (below the waves) is green (which means there is a lot of buying recently), in that case we are looking for a long option. If it is red (ofcourse) we are looking for a short option.
- The green dots below the blue waves represent a buy signal and if the blue wave is oversold (below 60) the green dot is considered a BIG buy signal (more probability of a good trade). The big buy signals are also plotted on the horizontal bar. So a green dot on the bar while the bar is also green represents a buy signal. You can exit the long when a red dot appears in the blue wave above the zero line.
- Another way to use it is to look for divergence of the blue waves. When a blue wave below the zero line appears and then a new wave (some time later) appears which is smaller than the previous, this is considered a good entry point for a long.
- The yellow represents the VWAP (which can be used as a confirmation (crossing up means buying, crossing down means selling)
The RSI is also added (yellow line) oscillating between 100 and 200 (is moved up by 100).
The Stoch RSI is also added (blue and red lines) on the same interval as the RSI.
For improvements, ideas or questions, please don't hesitate to leave a message.
보호된 스크립트입니다
이 스크립트는 비공개 소스로 게시됩니다. 하지만 이를 자유롭게 제한 없이 사용할 수 있습니다 – 자세한 내용은 여기에서 확인하세요.
면책사항
해당 정보와 게시물은 금융, 투자, 트레이딩 또는 기타 유형의 조언이나 권장 사항으로 간주되지 않으며, 트레이딩뷰에서 제공하거나 보증하는 것이 아닙니다. 자세한 내용은 이용 약관을 참조하세요.
면책사항
해당 정보와 게시물은 금융, 투자, 트레이딩 또는 기타 유형의 조언이나 권장 사항으로 간주되지 않으며, 트레이딩뷰에서 제공하거나 보증하는 것이 아닙니다. 자세한 내용은 이용 약관을 참조하세요.