INVITE-ONLY SCRIPT
업데이트됨 Ghost Vision III
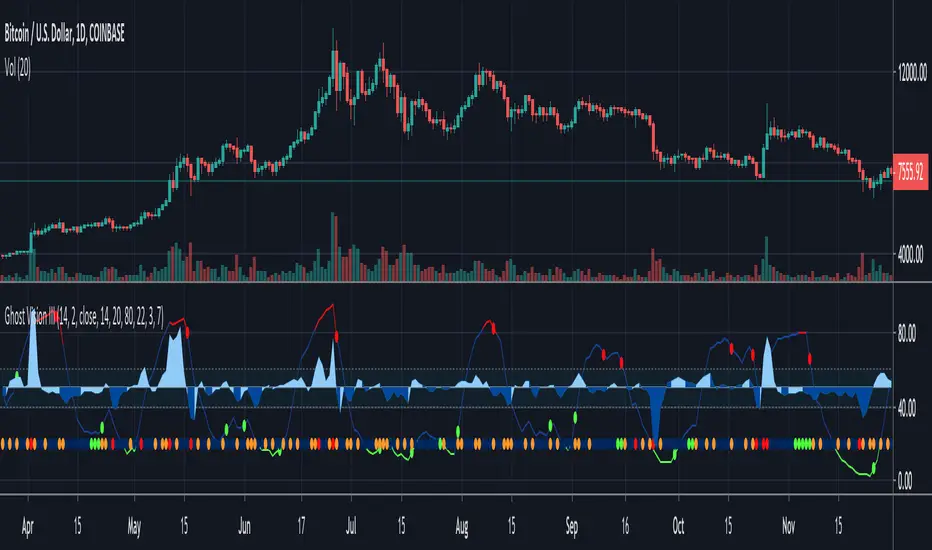
Green, red and blue lines can be over or under the baseline indicates oversold or overbought periods, green or red mountains are meant to explain price and volume momentum direction & strength. Dots are for market heat green is for less activity than normal blue for low activity, orange for a medium activity and red for high activity.
GhostVision III — Will answer you for the following questions:
Should I take a profit now?
The level amount of volume and price action?
Oversold or overbought?
Is it a pullback?
Can be used to:
Spot price moves that going to explode
Taking profit on extreme price movement
Spot fake price movements
Find pullback opportunities
Confirmations for GhostVision I & II
릴리즈 노트
Easier to use colors layout "Iceberg"릴리즈 노트
Price Strength Line Improvements:- Easier to use & see when and why we are overbought or oversold
- Double confirmation by line color and a dot (NEW)
For GhostVision Members:
Use it for a pullback strategy as an extra iceberg confirmation
릴리즈 노트
Reduce dots size초대 전용 스크립트
이 스크립트는 작성자가 승인한 사용자만 접근할 수 있습니다. 사용하려면 요청 후 승인을 받아야 하며, 일반적으로 결제 후에 허가가 부여됩니다. 자세한 내용은 아래 작성자의 안내를 따르거나 GhostVision에게 직접 문의하세요.
트레이딩뷰는 스크립트의 작동 방식을 충분히 이해하고 작성자를 완전히 신뢰하지 않는 이상, 해당 스크립트에 비용을 지불하거나 사용하는 것을 권장하지 않습니다. 커뮤니티 스크립트에서 무료 오픈소스 대안을 찾아보실 수도 있습니다.
작성자 지시 사항
면책사항
해당 정보와 게시물은 금융, 투자, 트레이딩 또는 기타 유형의 조언이나 권장 사항으로 간주되지 않으며, 트레이딩뷰에서 제공하거나 보증하는 것이 아닙니다. 자세한 내용은 이용 약관을 참조하세요.
초대 전용 스크립트
이 스크립트는 작성자가 승인한 사용자만 접근할 수 있습니다. 사용하려면 요청 후 승인을 받아야 하며, 일반적으로 결제 후에 허가가 부여됩니다. 자세한 내용은 아래 작성자의 안내를 따르거나 GhostVision에게 직접 문의하세요.
트레이딩뷰는 스크립트의 작동 방식을 충분히 이해하고 작성자를 완전히 신뢰하지 않는 이상, 해당 스크립트에 비용을 지불하거나 사용하는 것을 권장하지 않습니다. 커뮤니티 스크립트에서 무료 오픈소스 대안을 찾아보실 수도 있습니다.
작성자 지시 사항
면책사항
해당 정보와 게시물은 금융, 투자, 트레이딩 또는 기타 유형의 조언이나 권장 사항으로 간주되지 않으며, 트레이딩뷰에서 제공하거나 보증하는 것이 아닙니다. 자세한 내용은 이용 약관을 참조하세요.