INVITE-ONLY SCRIPT
업데이트됨 Non-Commercial Bias Tracker
Non-Commercial Bias Tracker
Overview
The Non-Commercial Bias Tracker is a sophisticated sentiment analysis tool designed to provide traders with a clear view of the positioning of institutional speculators in the futures market. By analyzing the weekly Commitment of Traders (COT) report, this indicator helps you understand the underlying bias of large market participants for a wide range of assets, including forex, commodities, and indices.
The primary goal of this tool is to identify the prevailing trend in market sentiment and alert you to significant shifts in that trend, allowing you to align your strategy with the flow of institutional money.
Key Features
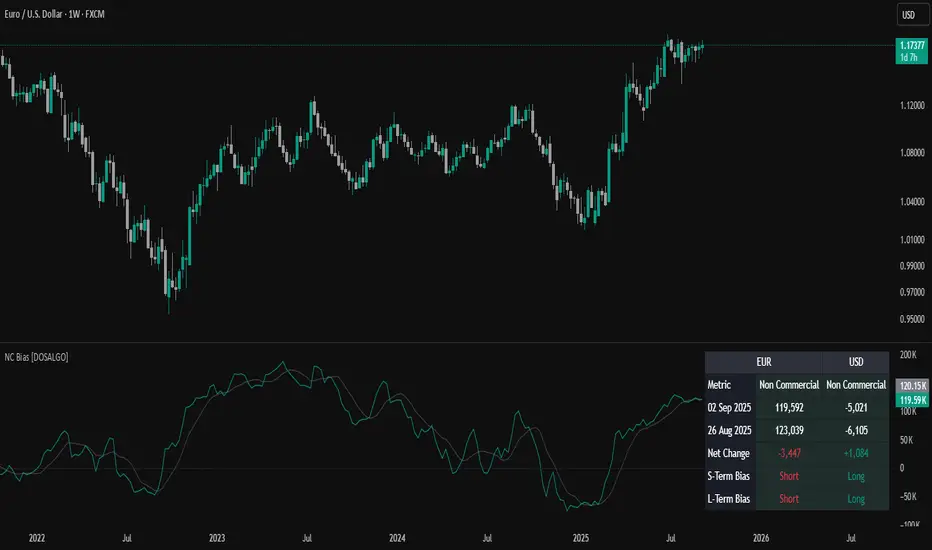
Dual Asset Analysis: Automatically detects the two assets in a trading pair (e.g., EUR and USD in EURUSD) or a single asset (e.g., GOLD) and displays their sentiment data side-by-side.
Comprehensive Data Table: A clean, customizable dashboard shows you the most critical sentiment metrics at a glance, including the current Net Position, the Change %, and the Overall Bias.
Visual Sentiment Plot: The indicator plots the primary sentiment metric and its signal line, giving you a visual representation of momentum and trend.
Clear Bias-Shift Signals: Green and red circles appear directly on the plot to highlight the exact moment the underlying sentiment momentum shifts, providing clear and timely signals.
How to Use the Indicator
Important Note: The Commitment of Traders data is released weekly. For the most accurate and meaningful signals, it is strongly recommended to use this indicator on the Weekly (W) chart timeframe.
1. The Data Table
The table in the corner of your screen is your main dashboard. Here’s what each row means:
Net Position: Shows the net difference between long (bullish) and short (bearish) contracts held by non-commercial traders. A positive number indicates a net long position; a negative number indicates a net short position.
Change %: This is the primary metric used for analysis, representing the net sentiment as a percentage.
Overall Bias: This is the final output of the indicator's analysis. It provides a clear "Long" or "Short" signal based on the current sentiment momentum. This cell is color-coded for quick interpretation (Green for Long, Red for Short).
2. The Chart Plots
Blue Line: Represents the current sentiment metric ("Change %" or "Net Position %").
Orange Line: Represents the signal line, or the average sentiment over a specific period.
Crossover Signals:
A Green Circle appears when the blue line crosses above the orange line, signaling a shift to a Long Bias.
A Red Circle appears when the blue line crosses below the orange line, signaling a shift to a Short Bias.
Settings & Customization
You can tailor the indicator to your specific needs via the Settings menu:
Data Source: Choose between "Futures Only" or the combined "Futures and Options" data.
Metric Type: Select whether to analyze the market using "Change %" (for momentum) or "Net Position %" (for conviction).
Bias Signal Line Length: Adjust the sensitivity of the crossover signals. A shorter length is faster, while a longer length provides smoother, more confirmed signals.
Style Settings: Customize the position of the data table and the color of the text to match your chart theme.
Disclaimer: This indicator is a tool for analysis and should not be considered as direct financial advice. All trading involves risk. Always use proper risk management and conduct your own due diligence before making any trading decisions.
Overview
The Non-Commercial Bias Tracker is a sophisticated sentiment analysis tool designed to provide traders with a clear view of the positioning of institutional speculators in the futures market. By analyzing the weekly Commitment of Traders (COT) report, this indicator helps you understand the underlying bias of large market participants for a wide range of assets, including forex, commodities, and indices.
The primary goal of this tool is to identify the prevailing trend in market sentiment and alert you to significant shifts in that trend, allowing you to align your strategy with the flow of institutional money.
Key Features
Dual Asset Analysis: Automatically detects the two assets in a trading pair (e.g., EUR and USD in EURUSD) or a single asset (e.g., GOLD) and displays their sentiment data side-by-side.
Comprehensive Data Table: A clean, customizable dashboard shows you the most critical sentiment metrics at a glance, including the current Net Position, the Change %, and the Overall Bias.
Visual Sentiment Plot: The indicator plots the primary sentiment metric and its signal line, giving you a visual representation of momentum and trend.
Clear Bias-Shift Signals: Green and red circles appear directly on the plot to highlight the exact moment the underlying sentiment momentum shifts, providing clear and timely signals.
How to Use the Indicator
Important Note: The Commitment of Traders data is released weekly. For the most accurate and meaningful signals, it is strongly recommended to use this indicator on the Weekly (W) chart timeframe.
1. The Data Table
The table in the corner of your screen is your main dashboard. Here’s what each row means:
Net Position: Shows the net difference between long (bullish) and short (bearish) contracts held by non-commercial traders. A positive number indicates a net long position; a negative number indicates a net short position.
Change %: This is the primary metric used for analysis, representing the net sentiment as a percentage.
Overall Bias: This is the final output of the indicator's analysis. It provides a clear "Long" or "Short" signal based on the current sentiment momentum. This cell is color-coded for quick interpretation (Green for Long, Red for Short).
2. The Chart Plots
Blue Line: Represents the current sentiment metric ("Change %" or "Net Position %").
Orange Line: Represents the signal line, or the average sentiment over a specific period.
Crossover Signals:
A Green Circle appears when the blue line crosses above the orange line, signaling a shift to a Long Bias.
A Red Circle appears when the blue line crosses below the orange line, signaling a shift to a Short Bias.
Settings & Customization
You can tailor the indicator to your specific needs via the Settings menu:
Data Source: Choose between "Futures Only" or the combined "Futures and Options" data.
Metric Type: Select whether to analyze the market using "Change %" (for momentum) or "Net Position %" (for conviction).
Bias Signal Line Length: Adjust the sensitivity of the crossover signals. A shorter length is faster, while a longer length provides smoother, more confirmed signals.
Style Settings: Customize the position of the data table and the color of the text to match your chart theme.
Disclaimer: This indicator is a tool for analysis and should not be considered as direct financial advice. All trading involves risk. Always use proper risk management and conduct your own due diligence before making any trading decisions.
릴리즈 노트
updated the chart릴리즈 노트
updated the label릴리즈 노트
updated the default signal line color릴리즈 노트
updated chart릴리즈 노트
Updated the logic to fetch weekly timeframe data only.릴리즈 노트
Updated the logic to classic CFTC report format릴리즈 노트
Updated the symbols list.릴리즈 노트
updated chart릴리즈 노트
Fixed a bug in timeframe shift릴리즈 노트
Fixed a bug, Restrict rule added - only weekly chart릴리즈 노트
Major Update: Introducing Conviction Bias, POIV & OI Analysis!We're excited to release a major upgrade to the Non-Commercial Bias Tracker! This version goes far beyond simple positioning by introducing several powerful new layers of analysis designed to measure market conviction and participation like never before.
What's New in This Version?
✅ New - Open Interest Analysis: The dashboard now includes Open Interest (OI) and its weekly change, a critical metric for gauging market participation.
✅ New - Proprietary POIV Gauge: Introducing POIV (Position & OI Volume), our unique, cumulative gauge for measuring the underlying force of market conviction.
✅ New - Conviction Bias Logic: A powerful new analysis that classifies institutional sentiment as 'Strong' or 'Weak', helping you filter for the highest quality signals.
IMPROVED - Renamed to 'Net Pos Bias': The 'Overall Bias' has been renamed to 'Net Pos Bias' for better clarity.
IMPROVED - Enhanced Tooltips: All new and existing settings feature detailed tooltips to help you customize the indicator with confidence.
How to Read and Use the New Features
Open Interest (OI) & OI Change
What it is: Open Interest represents the total number of open contracts. Its weekly change shows whether new money is flowing into or out of the market.
How to read it: A positive OI Change alongside a strong move confirms conviction. A negative OI Change suggests a lack of participation or profit-taking, even if the price is moving.
POIV - Your New Conviction Gauge
What it is: POIV is our proprietary gauge for tracking the cumulative force behind institutional moves.
How to read it: A steadily rising POIV suggests deep, sustained conviction and participation in the current trend. A flat or falling POIV can signal a weakening trend, even if positioning remains high.
Conviction Bias - Trade with More Confidence
What it is: This is our most powerful new feature. Our proprietary logic analyzes the relationship between positioning and market participation to label the sentiment as 'Strong' or 'Weak'.
How to read it: A "Strong Long" or "Strong Short" signal is our highest-conviction rating. Use this to focus on setups where institutional positioning is backed by genuine market participation.
We believe these powerful additions will provide you with a much deeper and more nuanced insight into market sentiment. Thank you for your continued support!
릴리즈 노트
updated the chart릴리즈 노트
Error, Revert the previous indicator until the new update is ready. 릴리즈 노트
Resolved all the bugs and successfully updated the above new features.릴리즈 노트
Fixed a bug - Timeframe L-Term Bias incorrect bias fixed.릴리즈 노트
Added new Theme feature and custom color options릴리즈 노트
Re-ordered the settings options릴리즈 노트
Fixed a bug found in dashboard color릴리즈 노트
Fixed logic bugs.Long term bias still show different value when switch between daily and weekly, will find a solution soon. So far the data is correct from backend. The visual line is smoothed.
릴리즈 노트
updated the colors릴리즈 노트
Updated COT data source릴리즈 노트
Rewritten the entire script with new methods to make sure no more bugs or incorrect calculations.릴리즈 노트
Updated the settings to be more compact. 릴리즈 노트
Added an option to plot Quote asset lines.릴리즈 노트
Fixed a data fetch bug.릴리즈 노트
Updated the default colors.릴리즈 노트
Cleaned up few codes and chart릴리즈 노트
Changed the codes to its original state. 릴리즈 노트
updated the indicator title릴리즈 노트
updated the authors instruction초대 전용 스크립트
이 스크립트는 작성자가 승인한 사용자만 접근할 수 있습니다. 사용하려면 요청 후 승인을 받아야 하며, 일반적으로 결제 후에 허가가 부여됩니다. 자세한 내용은 아래 작성자의 안내를 따르거나 DOSALGO에게 직접 문의하세요.
트레이딩뷰는 스크립트의 작동 방식을 충분히 이해하고 작성자를 완전히 신뢰하지 않는 이상, 해당 스크립트에 비용을 지불하거나 사용하는 것을 권장하지 않습니다. 커뮤니티 스크립트에서 무료 오픈소스 대안을 찾아보실 수도 있습니다.
작성자 지시 사항
Please submit https://forms.gle/3kfnEifaE5s32pVH8 form for access to this indicator. Kindly share your feedback and suggestions if you like the indicator.
Join our community: discord.gg/QnF9V62JWu
면책사항
해당 정보와 게시물은 금융, 투자, 트레이딩 또는 기타 유형의 조언이나 권장 사항으로 간주되지 않으며, 트레이딩뷰에서 제공하거나 보증하는 것이 아닙니다. 자세한 내용은 이용 약관을 참조하세요.
초대 전용 스크립트
이 스크립트는 작성자가 승인한 사용자만 접근할 수 있습니다. 사용하려면 요청 후 승인을 받아야 하며, 일반적으로 결제 후에 허가가 부여됩니다. 자세한 내용은 아래 작성자의 안내를 따르거나 DOSALGO에게 직접 문의하세요.
트레이딩뷰는 스크립트의 작동 방식을 충분히 이해하고 작성자를 완전히 신뢰하지 않는 이상, 해당 스크립트에 비용을 지불하거나 사용하는 것을 권장하지 않습니다. 커뮤니티 스크립트에서 무료 오픈소스 대안을 찾아보실 수도 있습니다.
작성자 지시 사항
Please submit https://forms.gle/3kfnEifaE5s32pVH8 form for access to this indicator. Kindly share your feedback and suggestions if you like the indicator.
Join our community: discord.gg/QnF9V62JWu
면책사항
해당 정보와 게시물은 금융, 투자, 트레이딩 또는 기타 유형의 조언이나 권장 사항으로 간주되지 않으며, 트레이딩뷰에서 제공하거나 보증하는 것이 아닙니다. 자세한 내용은 이용 약관을 참조하세요.