OPEN-SOURCE SCRIPT
업데이트됨 B3 Clear Method Streak Count
About Clear Method-- to repeat my prior post on the bar painter script:
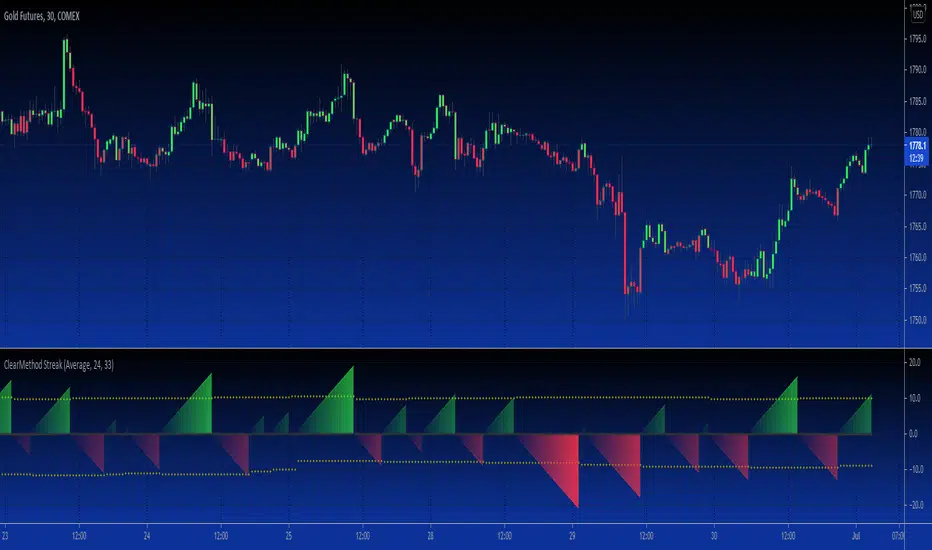
This indicator is translated out of Technical Analysis of Stocks & Commodities , September 2010, (I take zero design credit). The script simply looks for the price action to break or "clear" the most recent action, and only changes the paintbar color if the action indeed clears the previous candles. Simple to use, just add to your chart from your favorites and change the colors in the UI. It does the rest.
This version can replace my previous Clear Method Bar Painter as it also paints the bars.
What is different is this share is a lower study that counts the streak of the bars shown via histogram.
The way to use the streak is to notice the previous streaks and get a sense of how long the current trend is lasting versus prior trends of the same direction.
TradeStation recently posted their "price streak" study, and this one is quite similar in nature.
Enjoy, the code open to view,
_B3
d^.^b
릴리즈 노트
VERSION 4 PINESCRIPT UPDATE:- Added lines to the Long and Short side of zero that represent either the median, average, or extreme of an array depending on user inputs
- Colors are now customizable in first UI page
- Fading effect added to the colors
- Now an area graph instead of histogram
- *Barcolor does not fade
- Added zero line
Enjoy!
d^.^b
릴리즈 노트
-code cleanup-오픈 소스 스크립트
트레이딩뷰의 진정한 정신에 따라, 이 스크립트의 작성자는 이를 오픈소스로 공개하여 트레이더들이 기능을 검토하고 검증할 수 있도록 했습니다. 작성자에게 찬사를 보냅니다! 이 코드는 무료로 사용할 수 있지만, 코드를 재게시하는 경우 하우스 룰이 적용된다는 점을 기억하세요.
면책사항
해당 정보와 게시물은 금융, 투자, 트레이딩 또는 기타 유형의 조언이나 권장 사항으로 간주되지 않으며, 트레이딩뷰에서 제공하거나 보증하는 것이 아닙니다. 자세한 내용은 이용 약관을 참조하세요.
오픈 소스 스크립트
트레이딩뷰의 진정한 정신에 따라, 이 스크립트의 작성자는 이를 오픈소스로 공개하여 트레이더들이 기능을 검토하고 검증할 수 있도록 했습니다. 작성자에게 찬사를 보냅니다! 이 코드는 무료로 사용할 수 있지만, 코드를 재게시하는 경우 하우스 룰이 적용된다는 점을 기억하세요.
면책사항
해당 정보와 게시물은 금융, 투자, 트레이딩 또는 기타 유형의 조언이나 권장 사항으로 간주되지 않으며, 트레이딩뷰에서 제공하거나 보증하는 것이 아닙니다. 자세한 내용은 이용 약관을 참조하세요.