OPEN-SOURCE SCRIPT
업데이트됨 Large volume indicator to show the price above/below
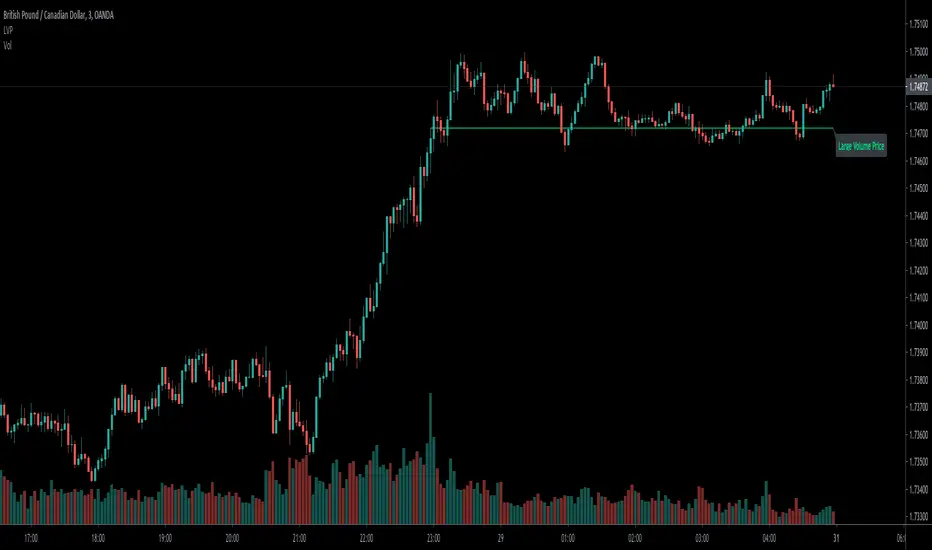
Large volume is meaningful that usually the current price above the highest price of the bars with largest volume usually means uptrend in the short-term.
In the opposite, below it means downtrend.
I coded this indicator to save the efforts to compare it, make it easily to tell the uptrend/downtrend by above/below and color.
Hope you guys enjoy it, and welcome to comment.
The Inputs:
Length:the largest volume of bars of the total bars numbers.
Color:the above/below colors.
Text:Remind this line is large volume R/S.
You can find the video tutorial in my ideas sharing.
릴리즈 노트
Hi,Guys,According to feedbacks of invisible,
1.I move the label to the right.
2.The background color of label can be self-defined.
3.Make the line thicker.
Thanks for comment and share how you feel when using it.
릴리즈 노트
Hi,guys,According to feedback of indicator, some modified functions as below:
1.Self-defined extend the line to the left largest volume bar or not.(Default is yes)
2.Self-defined the width of line (1-4) to be visible.(Default is 1, thinnest)
Hope you guys enjoy it, and welcome to leave your comments below.
Thanks.
오픈 소스 스크립트
트레이딩뷰의 진정한 정신에 따라, 이 스크립트의 작성자는 이를 오픈소스로 공개하여 트레이더들이 기능을 검토하고 검증할 수 있도록 했습니다. 작성자에게 찬사를 보냅니다! 이 코드는 무료로 사용할 수 있지만, 코드를 재게시하는 경우 하우스 룰이 적용된다는 점을 기억하세요.
면책사항
해당 정보와 게시물은 금융, 투자, 트레이딩 또는 기타 유형의 조언이나 권장 사항으로 간주되지 않으며, 트레이딩뷰에서 제공하거나 보증하는 것이 아닙니다. 자세한 내용은 이용 약관을 참조하세요.
오픈 소스 스크립트
트레이딩뷰의 진정한 정신에 따라, 이 스크립트의 작성자는 이를 오픈소스로 공개하여 트레이더들이 기능을 검토하고 검증할 수 있도록 했습니다. 작성자에게 찬사를 보냅니다! 이 코드는 무료로 사용할 수 있지만, 코드를 재게시하는 경우 하우스 룰이 적용된다는 점을 기억하세요.
면책사항
해당 정보와 게시물은 금융, 투자, 트레이딩 또는 기타 유형의 조언이나 권장 사항으로 간주되지 않으며, 트레이딩뷰에서 제공하거나 보증하는 것이 아닙니다. 자세한 내용은 이용 약관을 참조하세요.