INVITE-ONLY SCRIPT
업데이트됨 Stock Crash Risk (SCR)

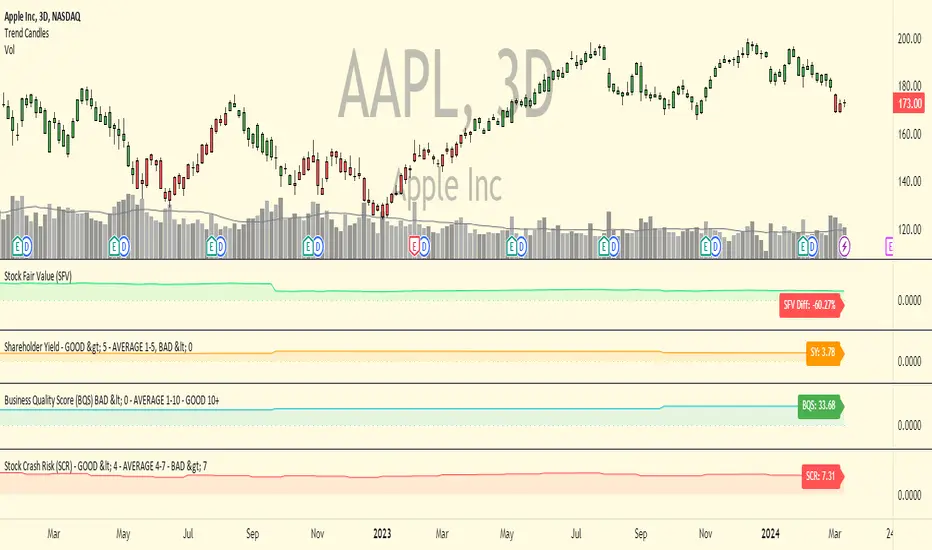
Stock Crash Risk (SCR) is an indicator that can be used to identify when a stock may be vulnerable to a crash. It's value is always between 1 meaning a very low risk of a crash to a high of 10 meaning a very high risk of a crash. Generally speaking readings above 8 should be considered high and caution used when investing in a stock. The only setting that can be changed by users is the lookback which by default is set to 7, meaning the indicator looks back at 7 months of price data to help determine the reading, it's recommended that users leave this setting to the default. This indicator is not designed for short term trading, the implications of high readings are usually months in advance so it's more suited towards stock investors however it can still be used to gauge potential crash risks for shorter term trades.
The indicator uses both price action and fundamental valuation metrics to calculate the reading. Generally speaking, when a stock price exhibits both extreme price sentiment and valuation it's likely to crash at some point. This indicator can also be used for the opposite use, meaning when it has a low reading under 3 it could be a good time to buy since both price and valuation are low.
This indicator is best used on stocks on the daily, weekly and monthly timeframes. It's value will always be the same regardless of what timeframe is used. Since it uses stock valuation this indicator cannot be used on other markets like forex, futures or crypto.
In the chart above you can see it applied to Peloton PTON on the weekly timeframe, you can see for most of the latter part of 2020 it had high readings above 9 indicating the stock is vulnerable to a crash which did subsequently happen over the following year. After reaching a high price of $171 in early January 2021 it fell 82% to a low of $31 within a year.
Below is another example of Zoom Video ZM with a similar pattern to Peloton, after showing high Stock Crash Risk readings above 9 it did subsequently crash over 70% the following 12 months.

Here's another example with Upstart UPST, after reaching a peak price of $401 in October 2021 with a SCR reading of 9.45 it subsequently crashed more than 73% over the next 3 months.

To get access to this indicator PM or email me to my address shown below.
Enjoy :)
Disclaimer: All my scripts and content are for educational purposes only. I'm not a financial advisor and do not give personal finance advice. Past performance is no guarantee of future performance. Please trade at your own risk.
The indicator uses both price action and fundamental valuation metrics to calculate the reading. Generally speaking, when a stock price exhibits both extreme price sentiment and valuation it's likely to crash at some point. This indicator can also be used for the opposite use, meaning when it has a low reading under 3 it could be a good time to buy since both price and valuation are low.
This indicator is best used on stocks on the daily, weekly and monthly timeframes. It's value will always be the same regardless of what timeframe is used. Since it uses stock valuation this indicator cannot be used on other markets like forex, futures or crypto.
In the chart above you can see it applied to Peloton
Below is another example of Zoom Video
Here's another example with Upstart
To get access to this indicator PM or email me to my address shown below.
Enjoy :)
Disclaimer: All my scripts and content are for educational purposes only. I'm not a financial advisor and do not give personal finance advice. Past performance is no guarantee of future performance. Please trade at your own risk.
릴리즈 노트
Updated indicator visualization for easier interpretation. Indicator logic remain the same.초대 전용 스크립트
이 스크립트는 작성자가 승인한 사용자만 접근할 수 있습니다. 사용하려면 요청 후 승인을 받아야 하며, 일반적으로 결제 후에 허가가 부여됩니다. 자세한 내용은 아래 작성자의 안내를 따르거나 Click-Capital에게 직접 문의하세요.
트레이딩뷰는 스크립트의 작동 방식을 충분히 이해하고 작성자를 완전히 신뢰하지 않는 이상, 해당 스크립트에 비용을 지불하거나 사용하는 것을 권장하지 않습니다. 커뮤니티 스크립트에서 무료 오픈소스 대안을 찾아보실 수도 있습니다.
작성자 지시 사항
Contact me using TradingView private chat or email me at scale@greenstonedigital.com to request access to my invite-only scripts.
면책사항
해당 정보와 게시물은 금융, 투자, 트레이딩 또는 기타 유형의 조언이나 권장 사항으로 간주되지 않으며, 트레이딩뷰에서 제공하거나 보증하는 것이 아닙니다. 자세한 내용은 이용 약관을 참조하세요.
초대 전용 스크립트
이 스크립트는 작성자가 승인한 사용자만 접근할 수 있습니다. 사용하려면 요청 후 승인을 받아야 하며, 일반적으로 결제 후에 허가가 부여됩니다. 자세한 내용은 아래 작성자의 안내를 따르거나 Click-Capital에게 직접 문의하세요.
트레이딩뷰는 스크립트의 작동 방식을 충분히 이해하고 작성자를 완전히 신뢰하지 않는 이상, 해당 스크립트에 비용을 지불하거나 사용하는 것을 권장하지 않습니다. 커뮤니티 스크립트에서 무료 오픈소스 대안을 찾아보실 수도 있습니다.
작성자 지시 사항
Contact me using TradingView private chat or email me at scale@greenstonedigital.com to request access to my invite-only scripts.
면책사항
해당 정보와 게시물은 금융, 투자, 트레이딩 또는 기타 유형의 조언이나 권장 사항으로 간주되지 않으며, 트레이딩뷰에서 제공하거나 보증하는 것이 아닙니다. 자세한 내용은 이용 약관을 참조하세요.