INVITE-ONLY SCRIPT
업데이트됨 Periodic Volume Profile+ [Pt]
This is a + version of my original Periodic Volume Profile indicator https://www.tradingview.com/script/MplWbXfb-Pt-Periodic-Volume-Profile/
This script includes the following extra unique features.
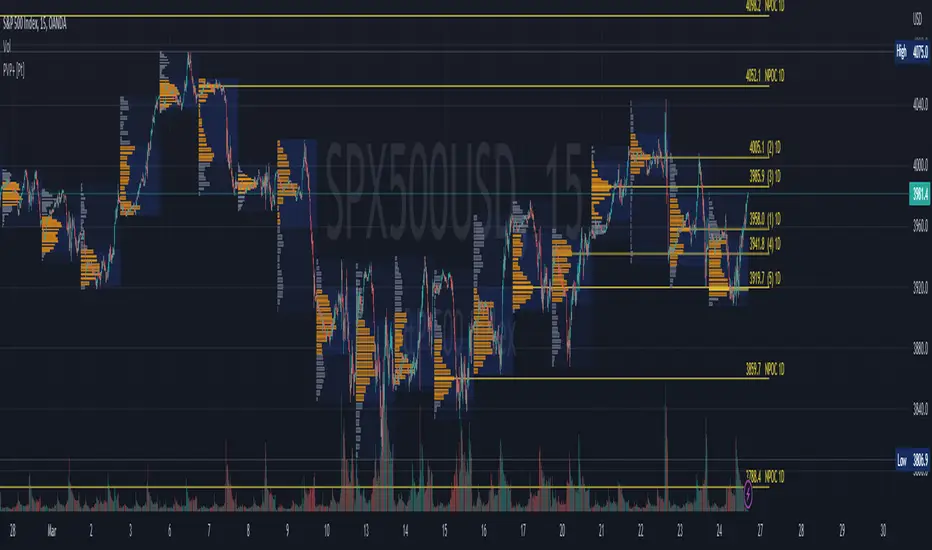
Show last X number of POC levels
- automatically draws these POC lines
- labels are shown as [Price] [# of period prior] [Periodic Timeframe]
- Naked POCs are labelled as NPOC
- label position and text size can be adjusted
Profile Range and Value Area background colors
- Option to color background based on periodic open/close price

Option to show Value Area High (VAH) and Value Area Low (VAL) Prices

What is Volume Profile?
Volume profile is a technical analysis tool that shows the volume of trades at different prices for a given security or market over a specific period of time.
How to effectively use it?
This script includes the following extra unique features.
Show last X number of POC levels
- automatically draws these POC lines
- labels are shown as [Price] [# of period prior] [Periodic Timeframe]
- Naked POCs are labelled as NPOC
- label position and text size can be adjusted
Profile Range and Value Area background colors
- Option to color background based on periodic open/close price
Option to show Value Area High (VAH) and Value Area Low (VAL) Prices
What is Volume Profile?
Volume profile is a technical analysis tool that shows the volume of trades at different prices for a given security or market over a specific period of time.
How to effectively use it?
- Identify key levels of support and resistance: The Periodic Volume Profile indicator can be used to identify key levels of support and resistance based on the volume of trades at different price levels. High volume areas can indicate strong support or resistance levels, while low volume areas can indicate areas of weakness or potential breakouts.
- Assess overall supply and demand: The Periodic Volume Profile indicator can help traders assess overall supply and demand for a security. If there is high volume at a particular price level, this can indicate a high level of demand, while low volume can indicate low demand.
- Use it in conjunction with other indicators: The Periodic Volume Profile indicator is best used in conjunction with other technical analysis tools. For example, you can use it with moving averages, trend lines, or other indicators to confirm signals or identify potential entry and exit points.
- Consider the overall market context: It's important to consider the overall market context when interpreting volume profile data. For example, a high volume area may not necessarily indicate a strong level of support or resistance if the overall market is in a downtrend.
- Monitor changes over time: Keep an eye on how the volume profile changes over time. If there are significant changes in the volume of trades at certain price levels, this could indicate a shift in market sentiment or a change in the underlying fundamentals of the security.
릴리즈 노트
Updated Profile reset option to enable reset at the start of regular sessions.By default, the Reset option is turned off. Volume Profile will carry forward from last session into the next session:
https://www.tradingview.com/x/EVcQ14hM/
With reset option turned on, profile will reset at the start of the new regular session:
https://www.tradingview.com/x/mQhm6LSV/
릴리즈 노트
Bug fixed:- Error on displaying periodic profiles on Forex tickers
릴리즈 노트
Added customizable POC line thickness option릴리즈 노트
Minor update:- POC line width setting now also applies to non-extended POC lines, including developing profile POC
초대 전용 스크립트
이 스크립트는 작성자가 승인한 사용자만 접근할 수 있습니다. 사용하려면 요청 후 승인을 받아야 하며, 일반적으로 결제 후에 허가가 부여됩니다. 자세한 내용은 아래 작성자의 안내를 따르거나 PtGambler에게 직접 문의하세요.
트레이딩뷰는 스크립트의 작동 방식을 충분히 이해하고 작성자를 완전히 신뢰하지 않는 이상, 해당 스크립트에 비용을 지불하거나 사용하는 것을 권장하지 않습니다. 커뮤니티 스크립트에서 무료 오픈소스 대안을 찾아보실 수도 있습니다.
작성자 지시 사항
DM or reach me through my channels.
Purchases / Subscriptions / Support - buymeacoffee.com/ptgambler
PayPal - paypal.me/PtGambler
You can reach me privately through my Discord Channel: discord.gg/WMQfaVGyQC
PayPal - paypal.me/PtGambler
You can reach me privately through my Discord Channel: discord.gg/WMQfaVGyQC
면책사항
해당 정보와 게시물은 금융, 투자, 트레이딩 또는 기타 유형의 조언이나 권장 사항으로 간주되지 않으며, 트레이딩뷰에서 제공하거나 보증하는 것이 아닙니다. 자세한 내용은 이용 약관을 참조하세요.