INVITE-ONLY SCRIPT
Yield Trend Indicator - The Quant Science
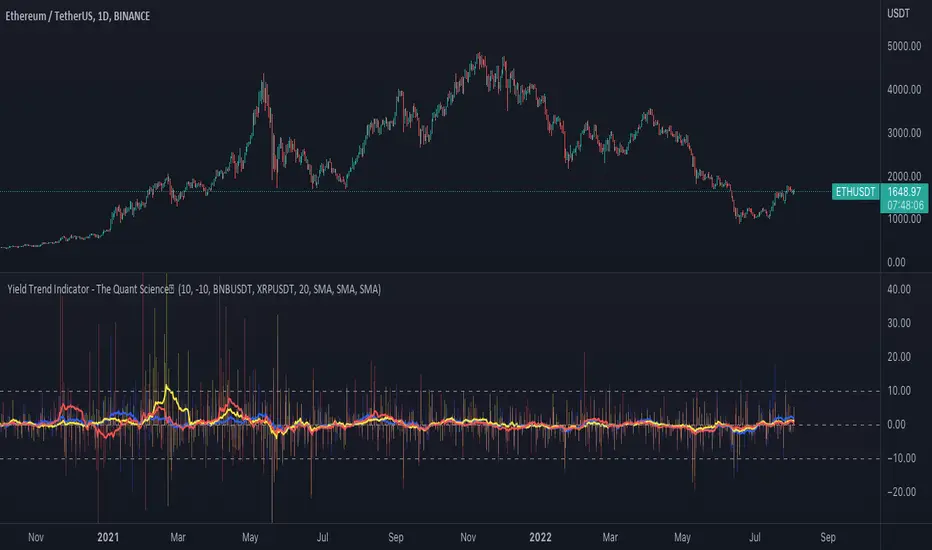
Yield Trend Indicator - The Quant Science™ is a quantitative indicator representing percentage yields and average percentage yields of three different assets.
Percentage yields are fundamental data for all quantitative analysts. This indicator was created to offer immediate calculations and represent them through an indicator consisting of lines and columns. The columns represent the percentage yield of the current timeframe, for each asset. The lines represent the average percentage yield, of the current timeframe, for each asset.
The user easily adds tickers from the user interface and the algorithm will automatically create the quantitative data of the chosen assets.
The blue refers to the main asset, the main set on the chart.
The yellow refers to the second asset, added by the user interface.
The red refers to the third asset, added by the user interface.
The timeframe is for all assets the one set to the chart, if you use a chart with timeframe D, all data is processed on this timeframe. You can use this indicator on all timeframes without any restrictions.
The user can change the type of formula for calculating the average yield easily via the user interface. This software includes the following formulas:
1. SMA (Simple Moving Average)
2. EMA (Exponential Moving Average)
3. WMA (Weighted Moving Average)
4. VWMA (Volume Weighted Moving Average)
The user can customize the indicator easily through the user interface, changing colours and many other parameters to represent the data on the chart.
초대 전용 스크립트
이 스크립트는 작성자가 승인한 사용자만 접근할 수 있습니다. 사용하려면 요청 후 승인을 받아야 하며, 일반적으로 결제 후에 허가가 부여됩니다. 자세한 내용은 아래 작성자의 안내를 따르거나 thequantscience에게 직접 문의하세요.
트레이딩뷰는 스크립트의 작동 방식을 충분히 이해하고 작성자를 완전히 신뢰하지 않는 이상, 해당 스크립트에 비용을 지불하거나 사용하는 것을 권장하지 않습니다. 커뮤니티 스크립트에서 무료 오픈소스 대안을 찾아보실 수도 있습니다.
작성자 지시 사항
You can unlock this indicator from our website. For any information or questions about this script contact us on Trading View private chat.
면책사항
해당 정보와 게시물은 금융, 투자, 트레이딩 또는 기타 유형의 조언이나 권장 사항으로 간주되지 않으며, 트레이딩뷰에서 제공하거나 보증하는 것이 아닙니다. 자세한 내용은 이용 약관을 참조하세요.