INVITE-ONLY SCRIPT
Market Trading Tools - Auto Adjustable Support & Resistance
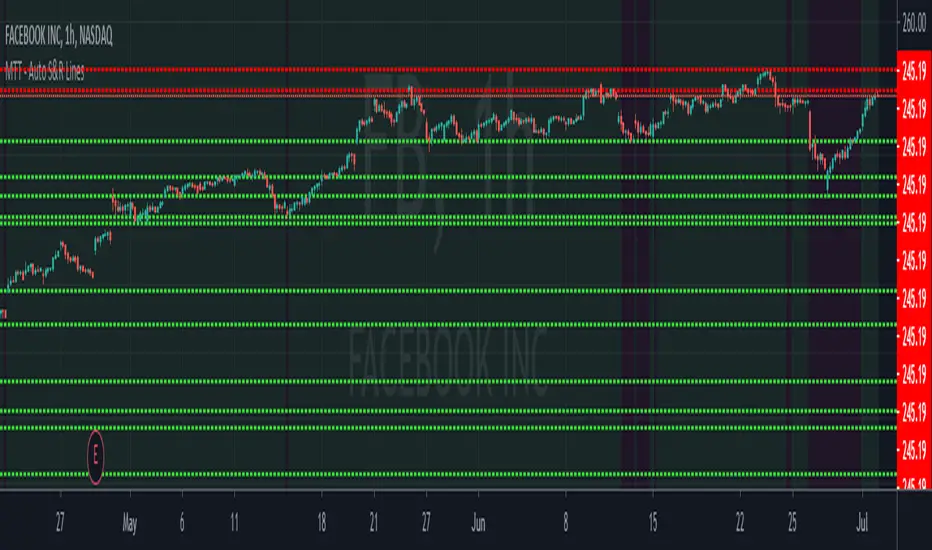
Our Auto Adjustable Support & Resistance indicator draws support and resistance lines that can help you estimate where a ticker or financial asset can range, reach or break. The support lines are in lime color while the resistance lines are in red. The colors will automatically change depending on where the candle is. So for example, if the candle is above the support line, the support line will be in lime, if it breaks that support line and closes below it, the same line will turn red becoming a resistance.
** The lines are adjustable, for example, if a stock or financial market broke a resistance and is moving to its all time high, then the line will keep moving with it until it rejects a certain zone. Accordingly, the supports below it will change to the nearest supports formed.
** The indicator can be used on any financial market; crypto, stocks or forex. We do not recommend a certain time frame as each time frame usually has its own support and resistance (the higher the time frame is the similar it will have same support and resistance zones, for example, a 4HR and 1 Day time frame might have similar support and resistance zones)
Once you are granted access to use it, add it from going into the scripts >> invite only scripts >> enable the indicator. Once the indicator is added to your chart you will see the indicator popping up on your chart.
We are happy to announce that our trading indicator is special and unique from different ones because it is adjustable to the current price ranges. We have also enabled a function for our users to get a better view of the trend when they add the indicator to their chart. You can now view the trend background color (red&green) depending on if the price is above the EMA of your choice. you can also check whichever time interval you want that does not limit you to the time interval chosen on your chart itself.
Hope you enjoy it, Good luck and stay safe!
** If you are interested in this indicator. please use the link below to obtain access to this indicator.
초대 전용 스크립트
이 스크립트는 작성자가 승인한 사용자만 접근할 수 있습니다. 사용하려면 요청 후 승인을 받아야 하며, 일반적으로 결제 후에 허가가 부여됩니다. 자세한 내용은 아래 작성자의 안내를 따르거나 MarketTradingTools에게 직접 문의하세요.
트레이딩뷰는 스크립트의 작동 방식을 충분히 이해하고 작성자를 완전히 신뢰하지 않는 이상, 해당 스크립트에 비용을 지불하거나 사용하는 것을 권장하지 않습니다. 커뮤니티 스크립트에서 무료 오픈소스 대안을 찾아보실 수도 있습니다.
작성자 지시 사항
면책사항
해당 정보와 게시물은 금융, 투자, 트레이딩 또는 기타 유형의 조언이나 권장 사항으로 간주되지 않으며, 트레이딩뷰에서 제공하거나 보증하는 것이 아닙니다. 자세한 내용은 이용 약관을 참조하세요.