OPEN-SOURCE SCRIPT
업데이트됨 Welkin Advanced Volume Overlay (for VSA)
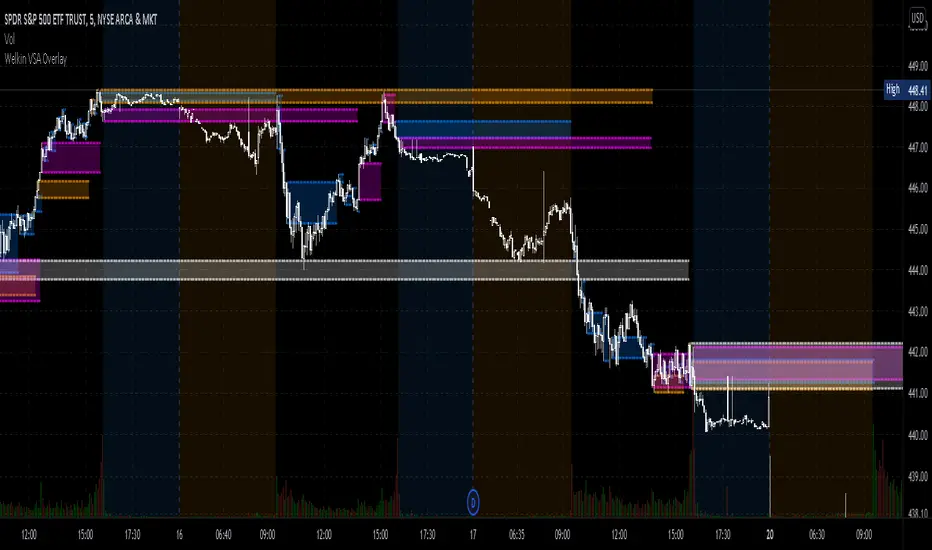
This is a PineScript translation of Welkin's Advanced Volume Indicator Overlay, originally written for ThinkOrSwim. This tool is designed to facilitate Volume Spread Analysis (VSA) by highlighting areas of above average volume alongside price movement.
This indicator does two things:
1. Plots lines that extend from candles of above average, high, and very high volume.
2. Colors in candles with colors indicating volume levels (when "Paint Candles With Volume Colors" is enabled).
Blue lines mark candles with Average volume, based on a 20 SMA.
Orange lines mark 2-sigma (2 times standard deviations higher) volume.
Magenta lines mark 3-sigma (3 times standard deviations higher) volume.
When enabled, gray colored candles indicate below average volume.
Yellow candles indicate volume that is relatively higher than the previous candle, default is 1.25x.
릴리즈 노트
1) Added a sigma-4 level to the possible volume tiers, represented by white lines.2) Cleaned up some plot code to make customizing colors easier.
릴리즈 노트
Added a toggle between dots and lines to make it easier to swap without having to change every plot.릴리즈 노트
Added a visibility setting for setting transparency easily.릴리즈 노트
Added an optional fill mode for the volume level lines to better highlight those zones.릴리즈 노트
Added a toggle to allow for ignoring Extended Hours data when calculating volume ranges. (defaults to ON; extended hours volume is usually far below average and tends to artificially skew the results)릴리즈 노트
Mostly cleaning up unused stuff, as well as improving some of the drawing features so you don't get angled lines from one zone to another. Also added an optional "show previous range" toggle for each sigma level.릴리즈 노트
Fixed minor visual bug in the drawing of previous zones.릴리즈 노트
Fixed a bug that was causing unexpected behavior for time frames between 1 hour and 1 day.릴리즈 노트
- Added a custom timeframe option for displaying volume zones from higher timeframes.
- Improved visibility settings.
릴리즈 노트
Added line/dot thickness as a settings option.릴리즈 노트
- Updated to PineScript 5v.
- Added a setting to use the "next" highest timeframe for plotting zones to make it easier to double up the indicator for multi-timeframe analysis.
릴리즈 노트
Forgive me father, for I have fibbed.- Added the option to display Fibonacci levels within volume zones. Defaults to "off". This draws lines at the 0.236 and 0.618 levels between midpoint and ceiling/floor of the zones (excluding the "Above Average" zones due to plot drawing restrictions).
릴리즈 노트
- Cleaned up inputs and split out fills and fibs options for each individual volume level.
릴리즈 노트
- moar input layout tweaks.
릴리즈 노트
- Fixed some input layout issues.
릴리즈 노트
I noticed a problem with the zone drawing being off for higher timeframe (1h and greater) that I can't seem to sort out. It seems to be related to the security() calls so for now I've made a temporary fix that bypasses the security call when using the "chart" timeframe.오픈 소스 스크립트
트레이딩뷰의 진정한 정신에 따라, 이 스크립트의 작성자는 이를 오픈소스로 공개하여 트레이더들이 기능을 검토하고 검증할 수 있도록 했습니다. 작성자에게 찬사를 보냅니다! 이 코드는 무료로 사용할 수 있지만, 코드를 재게시하는 경우 하우스 룰이 적용된다는 점을 기억하세요.
Thanks for using my indicators; I hope they make you money! Check out the website link for more, and thanks for your support!
면책사항
해당 정보와 게시물은 금융, 투자, 트레이딩 또는 기타 유형의 조언이나 권장 사항으로 간주되지 않으며, 트레이딩뷰에서 제공하거나 보증하는 것이 아닙니다. 자세한 내용은 이용 약관을 참조하세요.
오픈 소스 스크립트
트레이딩뷰의 진정한 정신에 따라, 이 스크립트의 작성자는 이를 오픈소스로 공개하여 트레이더들이 기능을 검토하고 검증할 수 있도록 했습니다. 작성자에게 찬사를 보냅니다! 이 코드는 무료로 사용할 수 있지만, 코드를 재게시하는 경우 하우스 룰이 적용된다는 점을 기억하세요.
Thanks for using my indicators; I hope they make you money! Check out the website link for more, and thanks for your support!
면책사항
해당 정보와 게시물은 금융, 투자, 트레이딩 또는 기타 유형의 조언이나 권장 사항으로 간주되지 않으며, 트레이딩뷰에서 제공하거나 보증하는 것이 아닙니다. 자세한 내용은 이용 약관을 참조하세요.