INVITE-ONLY SCRIPT
Quintalytics BullBear Thrusters 19
NDICATOR DESCRIPTION
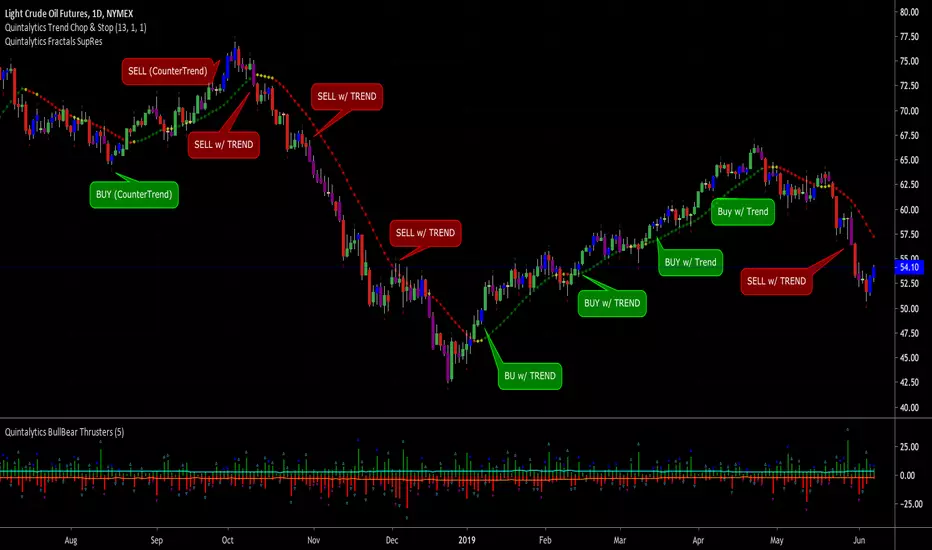
The “Quintalytics BullBear Thruster” indicator visualizes the balance of Buying and Selling pressure of the market for any given timeframe. It can be utilized as a Trade position setup/confirmation and Trade position exit/confirmation indicator. This indicator is suitable for use in all timeframes, markets, and chart types such as Bars, Candlesticks , Heiken Ashi, and Range.
BullBear Thrusters is presented on the chart as a Histogram (values above and below ZERO) along with a Bullish and Bearish Threshold line. A signal (Up and Down Arrows) is indicated via a Histogram plotted above or below the Threshold lines. The color of these arrows is determined by an algorithm based off of Buying and Selling Volume .
BUYING and SELLING PRESSURE Indications
The combination of the color and location of the Histogram and Threshold lines can provide information on the direction and strength of a trend, as well as whether Buyers or Sellers are affecting price movement.
The Color GREEN indicates the presence of a Buying Pressure.
The Color RED indicates the presence of a Selling Pressure.
The Color BLUE indicates Pricing Action is more influenced by BUYERS
The Color MAGENTA indicates Price Action is more influenced by SELLERS
TRADE POSITION SETUPS/CONFIRMATIONS
The presence of a BLUE/MAGENTA Signal Arrow (and associated Barcolors) can be used as criteria for trade entry, exit, or take profit conditions. These should not be used as the sole method of trading, but rather in conjunction with other indicators and trading strategies, as well as Trailing Stop Loss indicators such as the Quintalytics “Trend, Stop, and Chop”
FOR LONG TRADE POSITION ENTRY CRITERIA OPTIONS:
• A BLUE Arrow/Bar in the presence of an established LONG Trend (Trend)
• A BLUE Arrow/Bar which CLOSE ABOVE a level of Resistance (Breakout)
• A BLUE Arrow/Bar the occurs 1-3 bars after a MAGENTA Arrow/Bar (Countertrend)
FOR SHORT TRADE POSITION ENTRY CRITERIA OPTIONS:
• A MAGENTA Arrow/Bar in the presence of an established SHORT Trend (Trend)
• A MAGENTA Arrow/Bar which CLOSE BELOW a level of Support (Breakout)
• A MAGENTA Arrow/Bar the occurs 1-3 bars after a BLUE Arrow/Bar (Countertrend)
FOR LONG TRADE POSITION EXIT/TAKE PROFIT CRITERIA OPTIONS:
• A MAGENTA Arrow/Bar
FOR SHORT TRADE POSITION EXIT/TAKE PROFIT CRITERIA OPTIONS:
• A BLUE Arrow/Bar
SETTINGS
The indicator has TWO parameters: “Threshold”, and “Barcolor”.
Adjusting the “Threshold” will affect the indicator’s overall level of sensitivity. The HIGHER the Threshold, the larger the Price Action and Volume will be needed in order to generate a signal Arrow. Recommended settings are: 5, 8, 13, and 21.
Adjusting the “Barcolor” will Enable/Disable to changing of the Color of the Price Bar on the Main Chart.
초대 전용 스크립트
이 스크립트는 작성자가 승인한 사용자만 접근할 수 있습니다. 사용하려면 요청 후 승인을 받아야 하며, 일반적으로 결제 후에 허가가 부여됩니다. 자세한 내용은 아래 작성자의 안내를 따르거나 quintalytics에게 직접 문의하세요.
트레이딩뷰는 스크립트의 작동 방식을 충분히 이해하고 작성자를 완전히 신뢰하지 않는 이상, 해당 스크립트에 비용을 지불하거나 사용하는 것을 권장하지 않습니다. 커뮤니티 스크립트에서 무료 오픈소스 대안을 찾아보실 수도 있습니다.
작성자 지시 사항
면책사항
해당 정보와 게시물은 금융, 투자, 트레이딩 또는 기타 유형의 조언이나 권장 사항으로 간주되지 않으며, 트레이딩뷰에서 제공하거나 보증하는 것이 아닙니다. 자세한 내용은 이용 약관을 참조하세요.