OPEN-SOURCE SCRIPT
VIX-Price Covariance Monitor

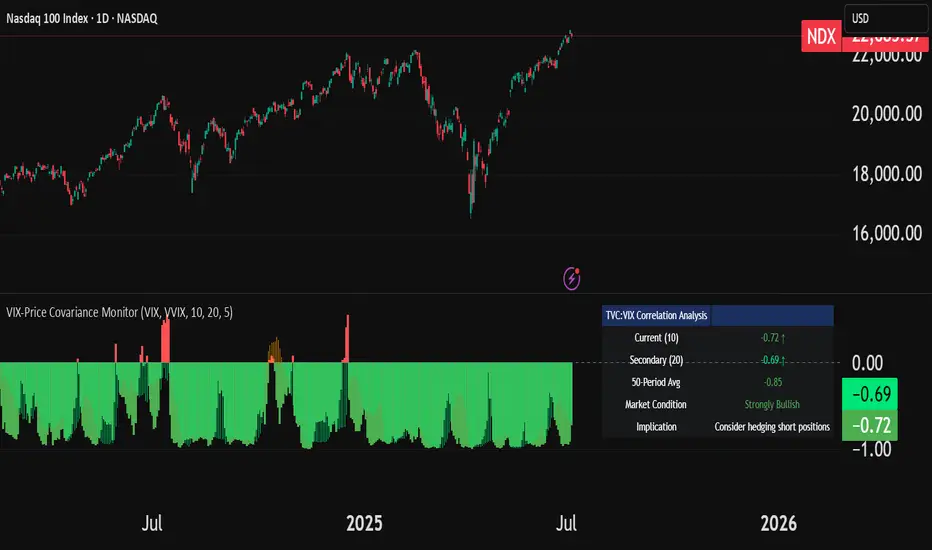
The VIX-Price Covariance Monitor is a statistical tool that measures the evolving relationship between a security's price and volatility indices such as the VIX (or VVIX).
It can give indication of potential market reversal, as typically, volatility and the VIX increase before markets turn red,
This indicator calculates the Pearson correlation coefficient using the formula:
ρ(X,Y) = cov(X,Y) / (σₓ × σᵧ)
Where:
Enjoy!
Features
Interpretation
How to use it
It can give indication of potential market reversal, as typically, volatility and the VIX increase before markets turn red,
This indicator calculates the Pearson correlation coefficient using the formula:
ρ(X,Y) = cov(X,Y) / (σₓ × σᵧ)
Where:
- ρ is the correlation coefficient
- cov(X,Y) is the covariance between price and the volatility index
- σₓ and σᵧ are the standard deviations of price and the volatility index
Enjoy!
Features
- Dual Correlation Periods: Analyze both short-term and long-term correlation trends simultaneously
- Adaptive Color Coding: Correlation strength is visually represented through color intensity
- Market Condition Assessment: Automatic interpretation of correlation values into actionable market insights
- Leading/Lagging Analysis: Optional time-shift analysis to detect predictive relationships
- Detailed Information Panel: Real-time statistics including current correlation values, historical averages, and trading implications
Interpretation
- Positive Correlation (Red): Typically bearish for price, as rising VIX correlates with falling markets. This is what traders should be looking for.
- Negative Correlation (Green): Typically bullish for price, as falling VIX correlates with rising markets
How to use it
- Apply the indicator to any chart to see its correlation with the default VIX index
- Adjust the correlation length to match your trading timeframe (shorter for day trading, longer for swing trading)
- Enable the secondary correlation period to compare different timeframes simultaneously
- For advanced analysis, enable the Leading/Lagging feature to detect if VIX changes precede or follow price movements
- Use the information panel to quickly assess the current market condition and potential trading implications
오픈 소스 스크립트
트레이딩뷰의 진정한 정신에 따라, 이 스크립트의 작성자는 이를 오픈소스로 공개하여 트레이더들이 기능을 검토하고 검증할 수 있도록 했습니다. 작성자에게 찬사를 보냅니다! 이 코드는 무료로 사용할 수 있지만, 코드를 재게시하는 경우 하우스 룰이 적용된다는 점을 기억하세요.
Medium Blog: medium.com/@henriquecentieiro
면책사항
해당 정보와 게시물은 금융, 투자, 트레이딩 또는 기타 유형의 조언이나 권장 사항으로 간주되지 않으며, 트레이딩뷰에서 제공하거나 보증하는 것이 아닙니다. 자세한 내용은 이용 약관을 참조하세요.