PROTECTED SOURCE SCRIPT
업데이트됨 Expected Move Bands
Expected Moves
The Expected Move of a security shows the amount that a stock is expected to rise or fall from its current market price based on its level of volatility or implied volatility. The expected move of a stock is usually measured with standard deviations.
An Expected Move Range of 1 SD shows that price will be near the 1 SD range 68% of the time given enough samples.
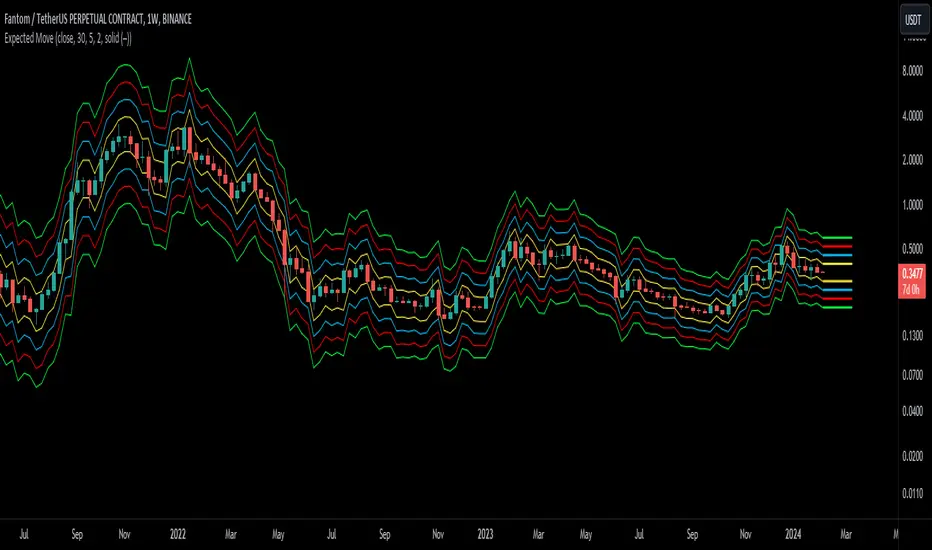
Expected Move Bands
This indicator gets the Expected Move for 1-4 Standard Deviation Ranges using Historical Volatility. Then it displays it on price as bands.
The Expected Move indicator also allows you to see MTF Expected Moves if you want to.
This indicator calculates the expected price movements by analyzing the historical volatility of an asset. Volatility is the measure of fluctuation.
This script uses log returns for the historical volatility calculation which can be modelled as a normal distribution most of the time meaning it is symmetrical and stationary unlike other scripts that use bands to find "reversals". They are fundamentally incorrect.
What these ranges tell you is basically the odds of the price movement being between these levels.
If you take enough samples, 95.5% of the them will be near the 2nd Standard Deviation. And so on. (The 3rd Standard deviation is 99.7%)
For higher timeframes you might need a smaller sample size.
Features


The Expected Move of a security shows the amount that a stock is expected to rise or fall from its current market price based on its level of volatility or implied volatility. The expected move of a stock is usually measured with standard deviations.
An Expected Move Range of 1 SD shows that price will be near the 1 SD range 68% of the time given enough samples.
Expected Move Bands
This indicator gets the Expected Move for 1-4 Standard Deviation Ranges using Historical Volatility. Then it displays it on price as bands.
The Expected Move indicator also allows you to see MTF Expected Moves if you want to.
This indicator calculates the expected price movements by analyzing the historical volatility of an asset. Volatility is the measure of fluctuation.
This script uses log returns for the historical volatility calculation which can be modelled as a normal distribution most of the time meaning it is symmetrical and stationary unlike other scripts that use bands to find "reversals". They are fundamentally incorrect.
What these ranges tell you is basically the odds of the price movement being between these levels.
If you take enough samples, 95.5% of the them will be near the 2nd Standard Deviation. And so on. (The 3rd Standard deviation is 99.7%)
For higher timeframes you might need a smaller sample size.
Features
- MTF Option
- Parameter customization
릴리즈 노트
Improved the volatility calculations.보호된 스크립트입니다
이 스크립트는 비공개 소스로 게시됩니다. 하지만 이를 자유롭게 제한 없이 사용할 수 있습니다 – 자세한 내용은 여기에서 확인하세요.
Link Tree: linktr.ee/tradersendeavors
Access our indicators: patreon.com/user?u=80987417
Access our indicators: patreon.com/user?u=80987417
면책사항
해당 정보와 게시물은 금융, 투자, 트레이딩 또는 기타 유형의 조언이나 권장 사항으로 간주되지 않으며, 트레이딩뷰에서 제공하거나 보증하는 것이 아닙니다. 자세한 내용은 이용 약관을 참조하세요.
보호된 스크립트입니다
이 스크립트는 비공개 소스로 게시됩니다. 하지만 이를 자유롭게 제한 없이 사용할 수 있습니다 – 자세한 내용은 여기에서 확인하세요.
Link Tree: linktr.ee/tradersendeavors
Access our indicators: patreon.com/user?u=80987417
Access our indicators: patreon.com/user?u=80987417
면책사항
해당 정보와 게시물은 금융, 투자, 트레이딩 또는 기타 유형의 조언이나 권장 사항으로 간주되지 않으며, 트레이딩뷰에서 제공하거나 보증하는 것이 아닙니다. 자세한 내용은 이용 약관을 참조하세요.