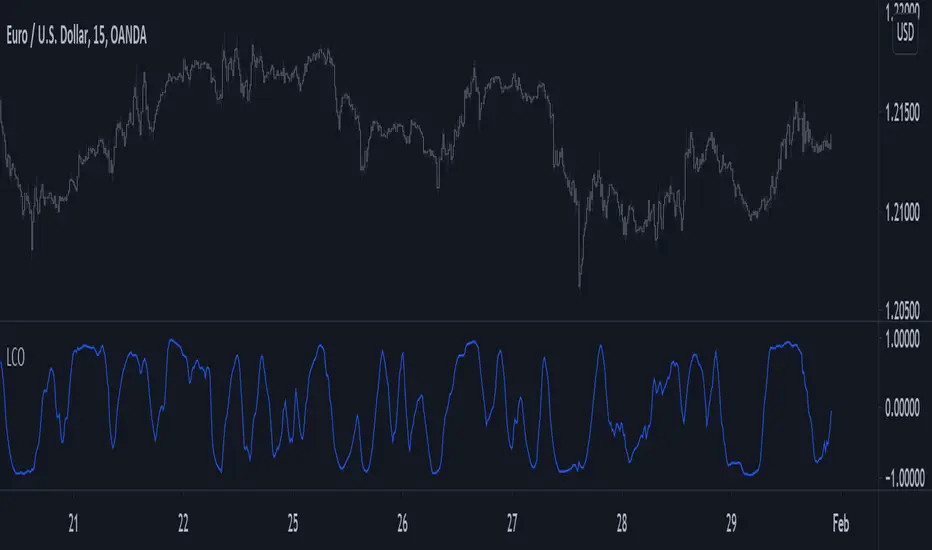
You don't need loops to get the rolling correlation between an input series and a linear sequence of values, this can be obtained from the normalized difference between a WMA and an SMA of the input series.
The closed-form solutions for the moving average and standard deviation of a linear sequence can be easily calculated, while the same rolling statistics for the input series can be computed using cumulative sums. All these concepts were introduced in previous indicators posts long ago.
This approach can allow to efficiently compute the rolling R-Squared of a linear regression, as well as its SSE.
Using the rolling correlation as a trend indicator is often attributed to John Ehlers with the correlation trend indicator (Correlation As A Trend Indicator), but the applications of this precise method can be traced back quite a while ago by a wide variety of users, in fact, the LSMA can be computed using this precise indicator. You can see an example where the correlation oscillator appears below:

오픈 소스 스크립트
트레이딩뷰의 진정한 정신에 따라, 이 스크립트의 작성자는 이를 오픈소스로 공개하여 트레이더들이 기능을 검토하고 검증할 수 있도록 했습니다. 작성자에게 찬사를 보냅니다! 이 코드는 무료로 사용할 수 있지만, 코드를 재게시하는 경우 하우스 룰이 적용된다는 점을 기억하세요.
Check out the indicators we are making at luxalgo: tradingview.com/u/LuxAlgo/
"My heart is so loud that I can't hear the fireworks"
"My heart is so loud that I can't hear the fireworks"
면책사항
해당 정보와 게시물은 금융, 투자, 트레이딩 또는 기타 유형의 조언이나 권장 사항으로 간주되지 않으며, 트레이딩뷰에서 제공하거나 보증하는 것이 아닙니다. 자세한 내용은 이용 약관을 참조하세요.
