OPEN-SOURCE SCRIPT
ADX+DMI MTF byPeterO
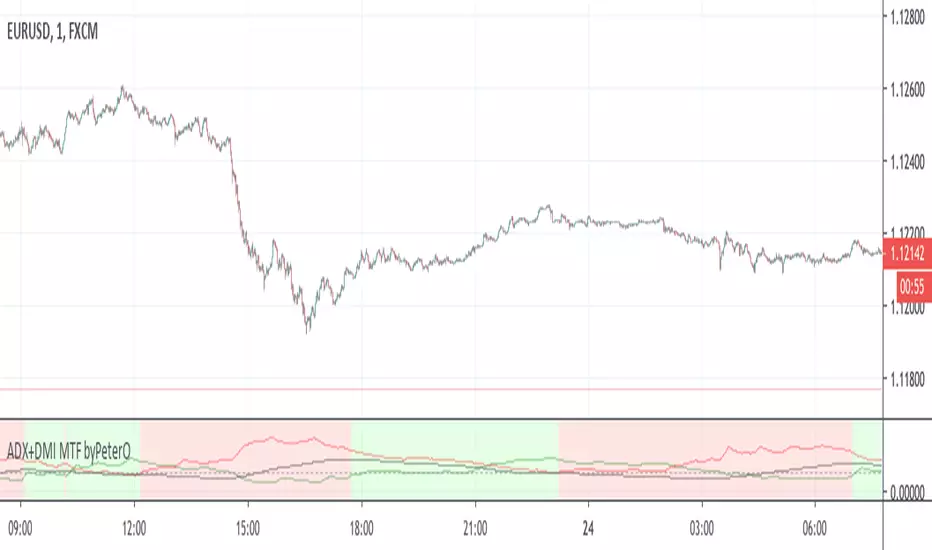
The goal of this study was to use ADX from Higher Timeframe - to determine trend direction
Why? Because ADX is very sensitive, able to show trend ending without any delay, but not in the middle of it.
Being able to see such immediate trend change on higher timeframe, is a great indicator of trend direction.
Adding just security() calls to 'highest', 'lowest' and 'close' didn't seem right, because it produced some ugly ADX, D+ and D- plotlines.
I wanted to see plotlines, which look exactly like those on actual higher timeframe. Therefore I modified the calculations.
You can read more about my take on (not) using security() calls in my other source code indicator RSI MTF: link in comments.
On top of all that, I added interpretation of DMI readings, because it is not as simple as plus>minus + ADXrising = uptrend.
So GREEN background means higher timeframe uptrend and RED background means downtrend.
오픈 소스 스크립트
트레이딩뷰의 진정한 정신에 따라, 이 스크립트의 작성자는 이를 오픈소스로 공개하여 트레이더들이 기능을 검토하고 검증할 수 있도록 했습니다. 작성자에게 찬사를 보냅니다! 이 코드는 무료로 사용할 수 있지만, 코드를 재게시하는 경우 하우스 룰이 적용된다는 점을 기억하세요.
I auto-execute TradingView Alerts into MT4/MT5 using this: tradingconnector.com 1-second delivery. Ping me if you need support with installation.
면책사항
해당 정보와 게시물은 금융, 투자, 트레이딩 또는 기타 유형의 조언이나 권장 사항으로 간주되지 않으며, 트레이딩뷰에서 제공하거나 보증하는 것이 아닙니다. 자세한 내용은 이용 약관을 참조하세요.