INVITE-ONLY SCRIPT
High Volume Key Hidden Level
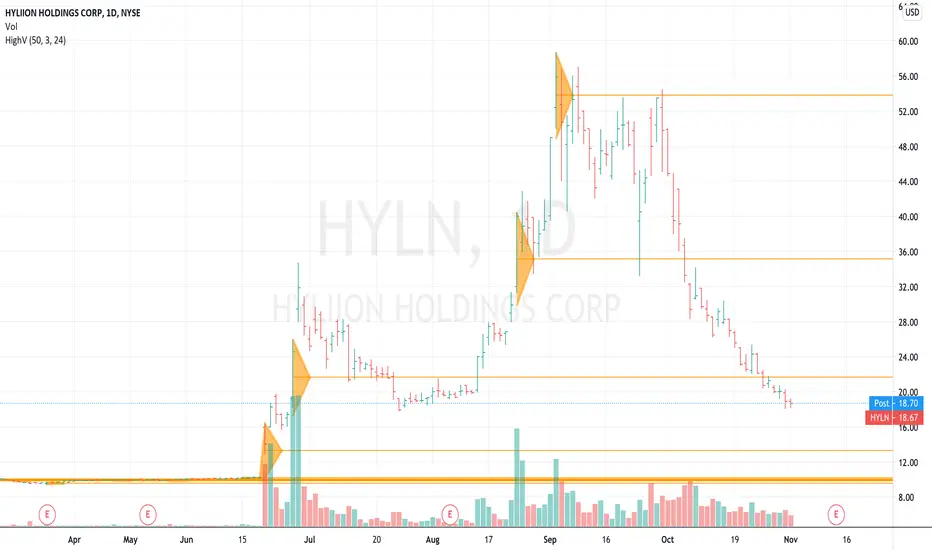
There are important price levels in the market that occur when high volumes of trading occur. The indicator is set to look for periods where there is 3x's the 50-period average volume and then it graphs a horizontal line going forward in time for reference as support or resistance.
Generally speaking, if the market rallies into a line then look for the market to stall at the line as it is a level of supply. Likewise, if the market falls down to a high volume level, then it would be logical to assume there is support at that level especially on the first and second revisit.
The indicator is adjustable so you can filter out to whatever multiple of any average. Some markets rarely have 3-times volume events, so you may have to adjust for each symbol.
High volume events indicate that news or an event has occured and should mark an important level where traders and investors may be interested in trading at that level again.
I would consider an uptrend to be in tact when the market is above the latest "high volume bar" and in a downtrend when the market is under the latest "high volume bar".
We use green triangles to plot earnings-release dates and blue triangles for dividends, yellow triangles for range expansion moves and black triangles for emotions (good and bad emotions such has fear and excitement).
초대 전용 스크립트
이 스크립트는 작성자가 승인한 사용자만 접근할 수 있습니다. 사용하려면 요청 후 승인을 받아야 하며, 일반적으로 결제 후에 허가가 부여됩니다. 자세한 내용은 아래 작성자의 안내를 따르거나 timwest에게 직접 문의하세요.
트레이딩뷰는 스크립트의 작동 방식을 충분히 이해하고 작성자를 완전히 신뢰하지 않는 이상, 해당 스크립트에 비용을 지불하거나 사용하는 것을 권장하지 않습니다. 커뮤니티 스크립트에서 무료 오픈소스 대안을 찾아보실 수도 있습니다.
작성자 지시 사항
Subscribe to my indicator package KEY HIDDEN LEVELS $10/mo or $100/year and join me in the trading room KEY HIDDEN LEVELS here at TradingView.com
면책사항
해당 정보와 게시물은 금융, 투자, 트레이딩 또는 기타 유형의 조언이나 권장 사항으로 간주되지 않으며, 트레이딩뷰에서 제공하거나 보증하는 것이 아닙니다. 자세한 내용은 이용 약관을 참조하세요.
초대 전용 스크립트
이 스크립트는 작성자가 승인한 사용자만 접근할 수 있습니다. 사용하려면 요청 후 승인을 받아야 하며, 일반적으로 결제 후에 허가가 부여됩니다. 자세한 내용은 아래 작성자의 안내를 따르거나 timwest에게 직접 문의하세요.
트레이딩뷰는 스크립트의 작동 방식을 충분히 이해하고 작성자를 완전히 신뢰하지 않는 이상, 해당 스크립트에 비용을 지불하거나 사용하는 것을 권장하지 않습니다. 커뮤니티 스크립트에서 무료 오픈소스 대안을 찾아보실 수도 있습니다.
작성자 지시 사항
면책사항
해당 정보와 게시물은 금융, 투자, 트레이딩 또는 기타 유형의 조언이나 권장 사항으로 간주되지 않으며, 트레이딩뷰에서 제공하거나 보증하는 것이 아닙니다. 자세한 내용은 이용 약관을 참조하세요.