OPEN-SOURCE SCRIPT
Bitcoin 2-Year MA Multiplier by Godtrix
Hi guys, I found this tool very useful and accurate, but can't find it on Trading View, so I made one for myself and everyone here ;)
Alert is available too.
Indicator Overview
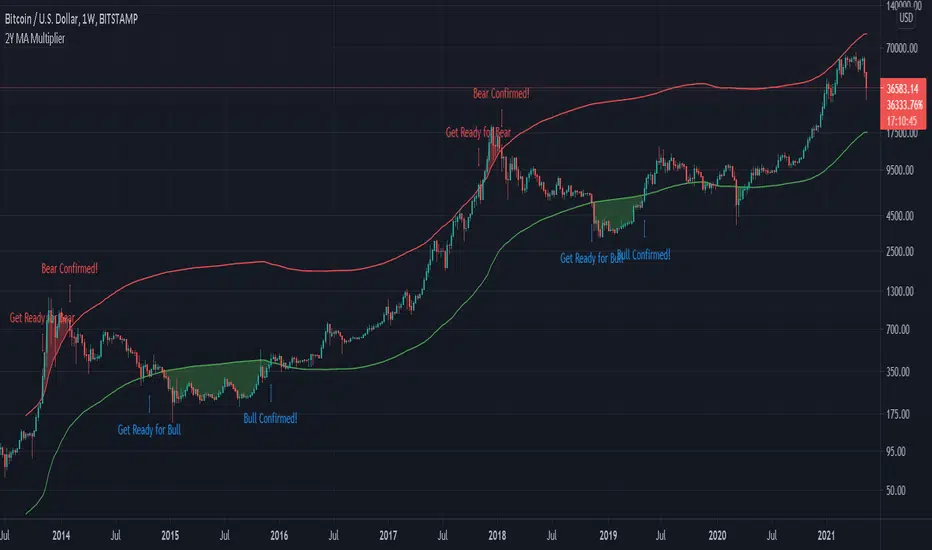
The 2-Year MA Multiplier is intended to be used as a long term investment tool.
It highlights periods where buying or selling Bitcoin during those times would have produced outsized returns.
To do this, it uses a moving average (MA) line, the 2yr MA, and also a multiplication of that moving average line, 2yr MA x5.
Note: the x5 multiplication is of the price values of the 2yr moving average, not of its time period.
Buying Bitcoin when price drops below the 2yr MA (green line) has historically generated outsized returns. Selling Bitcoin when price goes above the 2yr MA x 5 (red line) has been historically effective for taking profit.
Why This Happens
As Bitcoin is adopted, it moves through market cycles. These are created by periods where market participants are over-excited causing the price to over-extend, and periods where they are overly pessimistic where the price over-contracts. Identifying and understanding these periods can be beneficial to the long term investor.
This tool is a simple and effective way to highlight those periods.
Credit to & Created By
Philip Swift
Date Created
July 2017
BITSTAMP:BTCUSD
Alert is available too.
Indicator Overview
The 2-Year MA Multiplier is intended to be used as a long term investment tool.
It highlights periods where buying or selling Bitcoin during those times would have produced outsized returns.
To do this, it uses a moving average (MA) line, the 2yr MA, and also a multiplication of that moving average line, 2yr MA x5.
Note: the x5 multiplication is of the price values of the 2yr moving average, not of its time period.
Buying Bitcoin when price drops below the 2yr MA (green line) has historically generated outsized returns. Selling Bitcoin when price goes above the 2yr MA x 5 (red line) has been historically effective for taking profit.
Why This Happens
As Bitcoin is adopted, it moves through market cycles. These are created by periods where market participants are over-excited causing the price to over-extend, and periods where they are overly pessimistic where the price over-contracts. Identifying and understanding these periods can be beneficial to the long term investor.
This tool is a simple and effective way to highlight those periods.
Credit to & Created By
Philip Swift
Date Created
July 2017
BITSTAMP:BTCUSD
오픈 소스 스크립트
트레이딩뷰의 진정한 정신에 따라, 이 스크립트의 작성자는 이를 오픈소스로 공개하여 트레이더들이 기능을 검토하고 검증할 수 있도록 했습니다. 작성자에게 찬사를 보냅니다! 이 코드는 무료로 사용할 수 있지만, 코드를 재게시하는 경우 하우스 룰이 적용된다는 점을 기억하세요.
면책사항
해당 정보와 게시물은 금융, 투자, 트레이딩 또는 기타 유형의 조언이나 권장 사항으로 간주되지 않으며, 트레이딩뷰에서 제공하거나 보증하는 것이 아닙니다. 자세한 내용은 이용 약관을 참조하세요.
오픈 소스 스크립트
트레이딩뷰의 진정한 정신에 따라, 이 스크립트의 작성자는 이를 오픈소스로 공개하여 트레이더들이 기능을 검토하고 검증할 수 있도록 했습니다. 작성자에게 찬사를 보냅니다! 이 코드는 무료로 사용할 수 있지만, 코드를 재게시하는 경우 하우스 룰이 적용된다는 점을 기억하세요.
면책사항
해당 정보와 게시물은 금융, 투자, 트레이딩 또는 기타 유형의 조언이나 권장 사항으로 간주되지 않으며, 트레이딩뷰에서 제공하거나 보증하는 것이 아닙니다. 자세한 내용은 이용 약관을 참조하세요.