OPEN-SOURCE SCRIPT
RMSE Bollinger Bands + Loop | Lyro RS
RMSE Bollinger Bands + Loops
Overview
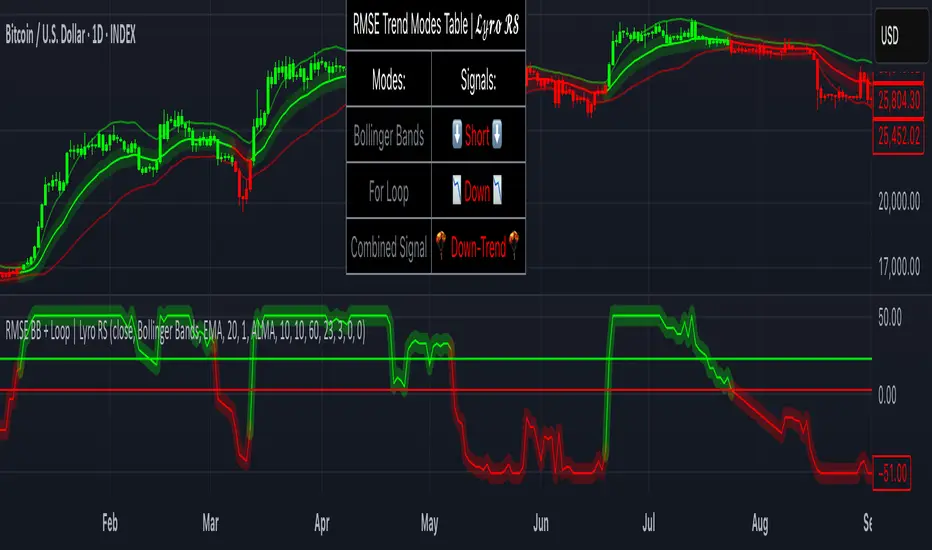
The RMSE Bollinger Bands + Loops is a sophisticated technical analysis tool designed to identify and quantify market trends by combining dynamic moving averages with statistical measures. This indicator employs a multi-model approach, integrating Bollinger-style RMSE bands, momentum scoring, and a hybrid signal system to provide traders with adaptive insights across varying market conditions.
Indicator Modes
Practical Application
Signal Interpretation: A buy signal is generated when both the RMSE Bands and For-Loop Momentum Scoring align bullishly. Conversely, a sell signal is indicated when both are bearish.
Trend Confirmation: The Hybrid Combined Signal provides a consolidated view, assisting traders in confirming the prevailing market trend.
Note: Always consider additional technical analysis tools and risk management strategies when making trading decisions.
⚠️Disclaimer
This indicator is a tool for technical analysis and does not provide guaranteed results. It should be used in conjunction with other analysis methods and proper risk management practices. The creators of this indicator are not responsible for any financial decisions made based on its signals.
Overview
The RMSE Bollinger Bands + Loops is a sophisticated technical analysis tool designed to identify and quantify market trends by combining dynamic moving averages with statistical measures. This indicator employs a multi-model approach, integrating Bollinger-style RMSE bands, momentum scoring, and a hybrid signal system to provide traders with adaptive insights across varying market conditions.
Indicator Modes
- Bollinger-style RMSE Bands: this mode calculates dynamic volatility bands around the price using the following formula:
Upper Band = Dynamic Moving Average + (RMSE × Multiplier)
Lower Band = Dynamic Moving Average - (RMSE × Multiplier)
These bands adjust to market volatility, helping identify potential breakout or breakdown points. - For-Loop Momentum Scoring, momentum is assessed by analyzing recent price behavior through a looping mechanism. A rising momentum score indicates increasing bullish strength, while a declining score suggests growing bearish momentum.
- Hybrid Combined Signal: this mode assigns a directional score to the other two modes:
+1 for bullish (green)
–1 for bearish (red)
An average of these scores is computed to generate a combined signal, offering a consolidated market trend indication.
Practical Application
Signal Interpretation: A buy signal is generated when both the RMSE Bands and For-Loop Momentum Scoring align bullishly. Conversely, a sell signal is indicated when both are bearish.
Trend Confirmation: The Hybrid Combined Signal provides a consolidated view, assisting traders in confirming the prevailing market trend.
Note: Always consider additional technical analysis tools and risk management strategies when making trading decisions.
⚠️Disclaimer
This indicator is a tool for technical analysis and does not provide guaranteed results. It should be used in conjunction with other analysis methods and proper risk management practices. The creators of this indicator are not responsible for any financial decisions made based on its signals.
오픈 소스 스크립트
트레이딩뷰의 진정한 정신에 따라, 이 스크립트의 작성자는 이를 오픈소스로 공개하여 트레이더들이 기능을 검토하고 검증할 수 있도록 했습니다. 작성자에게 찬사를 보냅니다! 이 코드는 무료로 사용할 수 있지만, 코드를 재게시하는 경우 하우스 룰이 적용된다는 점을 기억하세요.
Get access to our private indicators & analysis: whop.com/lyro-rs
Join our community: discord.gg/YUg8UxeRu8
All material from Lyro RS is for educational purposes only. Past performance does not guarantee future results.
Join our community: discord.gg/YUg8UxeRu8
All material from Lyro RS is for educational purposes only. Past performance does not guarantee future results.
면책사항
해당 정보와 게시물은 금융, 투자, 트레이딩 또는 기타 유형의 조언이나 권장 사항으로 간주되지 않으며, 트레이딩뷰에서 제공하거나 보증하는 것이 아닙니다. 자세한 내용은 이용 약관을 참조하세요.