OPEN-SOURCE SCRIPT
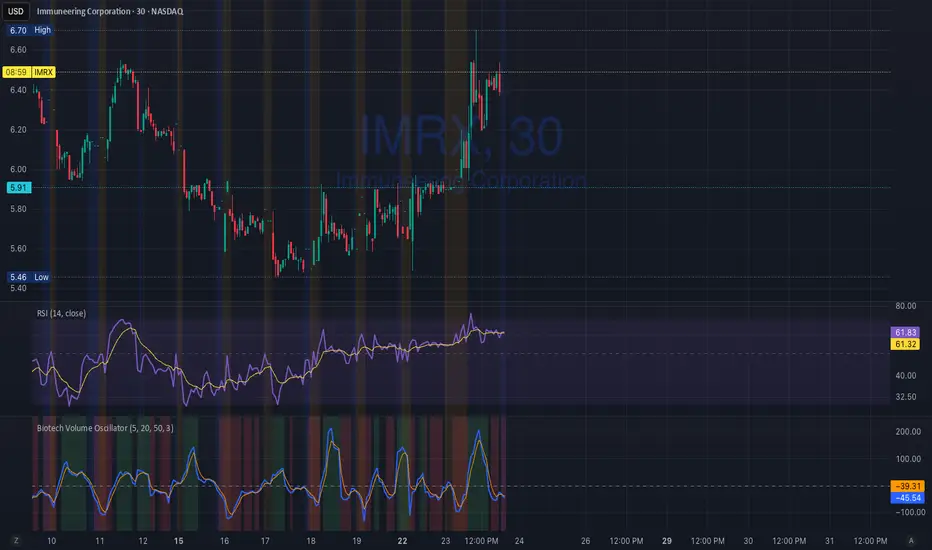
Biotech Volume Oscillator
1️⃣ What This Indicator Is (In One Sentence)
It tells you whether people are actually showing up to trade the stock, or if price is just drifting around on low interest.
That’s it.
It does not predict price.
It tells you whether a move is real or fragile.
2️⃣ What the Lines Mean
You see two lines:
🔵 Blue Line = Live Participation
Fast
Reacts immediately
Shows what traders are doing right now
Think:
“Is anyone actually trading this candle?”
🟠 Orange Line = Accepted Participation
Slower
Smoothed
Shows what the market has decided is normal
Think:
“Is this level of activity sticking?”
3️⃣ What the Numbers Mean (Very Important)
The numbers are percentages vs normal volume for this stock.
Around 0
Volume is normal
Nothing special happening
+10 to +25
Healthy interest
Traders are paying attention
Moves can continue
Above +25
Abnormal participation
News, hype, or institutions involved
Moves here tend to be fast
Below –20
Participation drying up
Drift, chop, fake breakouts
Below –30
Nobody is home
Price can move, but it’s fragile
Breakouts usually fail
4️⃣ How to Use It (Step-by-Step)
Step 1: Ignore Price for a Second
Look only at the oscillator.
Ask:
“Is this above zero or below zero?”
Step 2: Look at Direction
Rising oscillator → interest increasing
Falling oscillator → interest fading
Step 3: Compare Blue vs Orange
✅ Good / Healthy
Blue above orange
Both rising
→ New participation is entering
⚠️ Warning
Price rising
Blue flat or falling
Orange flat
→ Float, not conviction
🚨 Distribution
Blue rolls over from high levels
Orange follows
Price still looks “fine”
→ Selling into strength
오픈 소스 스크립트
트레이딩뷰의 진정한 정신에 따라, 이 스크립트의 작성자는 이를 오픈소스로 공개하여 트레이더들이 기능을 검토하고 검증할 수 있도록 했습니다. 작성자에게 찬사를 보냅니다! 이 코드는 무료로 사용할 수 있지만, 코드를 재게시하는 경우 하우스 룰이 적용된다는 점을 기억하세요.
면책사항
해당 정보와 게시물은 금융, 투자, 트레이딩 또는 기타 유형의 조언이나 권장 사항으로 간주되지 않으며, 트레이딩뷰에서 제공하거나 보증하는 것이 아닙니다. 자세한 내용은 이용 약관을 참조하세요.
오픈 소스 스크립트
트레이딩뷰의 진정한 정신에 따라, 이 스크립트의 작성자는 이를 오픈소스로 공개하여 트레이더들이 기능을 검토하고 검증할 수 있도록 했습니다. 작성자에게 찬사를 보냅니다! 이 코드는 무료로 사용할 수 있지만, 코드를 재게시하는 경우 하우스 룰이 적용된다는 점을 기억하세요.
면책사항
해당 정보와 게시물은 금융, 투자, 트레이딩 또는 기타 유형의 조언이나 권장 사항으로 간주되지 않으며, 트레이딩뷰에서 제공하거나 보증하는 것이 아닙니다. 자세한 내용은 이용 약관을 참조하세요.