OPEN-SOURCE SCRIPT
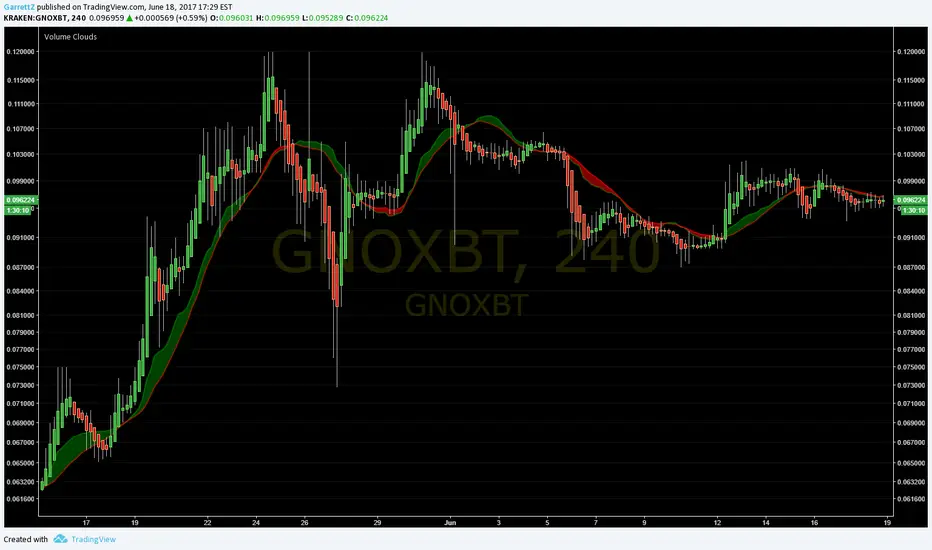
Volume Clouds
I know it isn't much, but it is my first time coding an indicator!
You might need to modify distance to fit the volatility and time frame of the chart you are looking at (if candles stay on top of cloud in an ugly mess, increase distance until signals can be seen). Sometimes heikin ashi candles can really help clear the picture up as well.
How to use:
The lines are the Volume Weighted Moving Average (green) and Simple Moving Average (red).
Cloud is green when VWMA is above SMA ( bullish ) and red when SMA is above VWMA ( bearish ).
The thicker the cloud, the stronger the signal. Also, the farther price strays from the cloud, the more pressure there is for it to return.
Look for divergences:
When price passes below a green cloud you have a bullish divergence (or if cloud turns green at crossing point)
Price pass above red cloud = bearish divergence.
Or confirmations:
Price passes below red cloud = bearish confirmation.
Price pass above green cloud = bullish confirmation.
I hope this helps you at least a little! Twitter: GarrettZ
오픈 소스 스크립트
트레이딩뷰의 진정한 정신에 따라, 이 스크립트의 작성자는 이를 오픈소스로 공개하여 트레이더들이 기능을 검토하고 검증할 수 있도록 했습니다. 작성자에게 찬사를 보냅니다! 이 코드는 무료로 사용할 수 있지만, 코드를 재게시하는 경우 하우스 룰이 적용된다는 점을 기억하세요.
면책사항
해당 정보와 게시물은 금융, 투자, 트레이딩 또는 기타 유형의 조언이나 권장 사항으로 간주되지 않으며, 트레이딩뷰에서 제공하거나 보증하는 것이 아닙니다. 자세한 내용은 이용 약관을 참조하세요.
오픈 소스 스크립트
트레이딩뷰의 진정한 정신에 따라, 이 스크립트의 작성자는 이를 오픈소스로 공개하여 트레이더들이 기능을 검토하고 검증할 수 있도록 했습니다. 작성자에게 찬사를 보냅니다! 이 코드는 무료로 사용할 수 있지만, 코드를 재게시하는 경우 하우스 룰이 적용된다는 점을 기억하세요.
면책사항
해당 정보와 게시물은 금융, 투자, 트레이딩 또는 기타 유형의 조언이나 권장 사항으로 간주되지 않으며, 트레이딩뷰에서 제공하거나 보증하는 것이 아닙니다. 자세한 내용은 이용 약관을 참조하세요.