PROTECTED SOURCE SCRIPT
CorrelationTrend
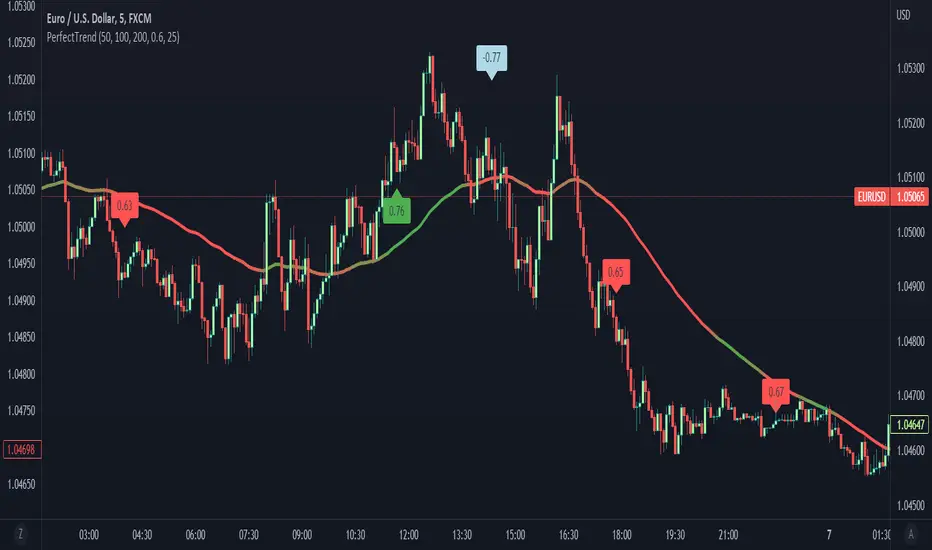
This indicator is a correlation based trend classifier.
How does it work:
- The software measures a correlation between 3 moving averages and the price.
- If there is a significant correlation and the price is moving upwards, the Moving average displayed on the chart is going to be green and if it is moving downwards, it is going to be red. And, if the correlation is not significant, the price is going to have yellow/orange shade.
- In case there is a strong negative correlation (= strong divergence between price and moving average), you will receive a light blue label on the chart. Such events can indicate possible reversals in the market
How to read correlation:
- The correlation value ranges from -1 to 1
- If the value is either bigger than 0.5 or lower than -0.5, the correlation is considered as significant and as the value is closer to 1 or -1, its significancy rises.
Correlation is larger than 0.5 --> means that there is a positive relationship between the direction of price and moving averages (there is a trend)
Correlation is lower than -0.5 --> means that there is a divergence between the direction of price and moving average(possible sudden change of the trend)
What can you see on the chart:
- Moving average--> based on its color you can get a sense of the trend
- Red/Green labels--> after the correlation value surpasses positive Precision trigger (defined in inputs), it creates a label to let you know of such event
- Light blue labels--> after the correlation is lower than negative Precision trigger (defined in inputs), it creates a label to let you know of possible price reversion
- Label on the current bar--> this label displays the current correlation value
Inputs:
- First MA Period = period of the first moving average
- Second MA Period = period of the second moving average
- Third MA Period = period of the third moving average
- Analysis span = number of bars used for computing
- Show flags = set to "true" if you wish to see the labels, otherwise set to "false"
- Show MA = set to "true" if you wish to see the moving average, otherwise set to "false"
Additional info:
- This indicator on its own should not be used as a source of entry signal
- Its main purpose is to give you a sense of the current trend and possible price reversions
보호된 스크립트입니다
이 스크립트는 비공개 소스로 게시됩니다. 하지만 이를 자유롭게 제한 없이 사용할 수 있습니다 – 자세한 내용은 여기에서 확인하세요.
면책사항
해당 정보와 게시물은 금융, 투자, 트레이딩 또는 기타 유형의 조언이나 권장 사항으로 간주되지 않으며, 트레이딩뷰에서 제공하거나 보증하는 것이 아닙니다. 자세한 내용은 이용 약관을 참조하세요.
면책사항
해당 정보와 게시물은 금융, 투자, 트레이딩 또는 기타 유형의 조언이나 권장 사항으로 간주되지 않으며, 트레이딩뷰에서 제공하거나 보증하는 것이 아닙니다. 자세한 내용은 이용 약관을 참조하세요.