OPEN-SOURCE SCRIPT
Volatility Bars (with Moving Averages)
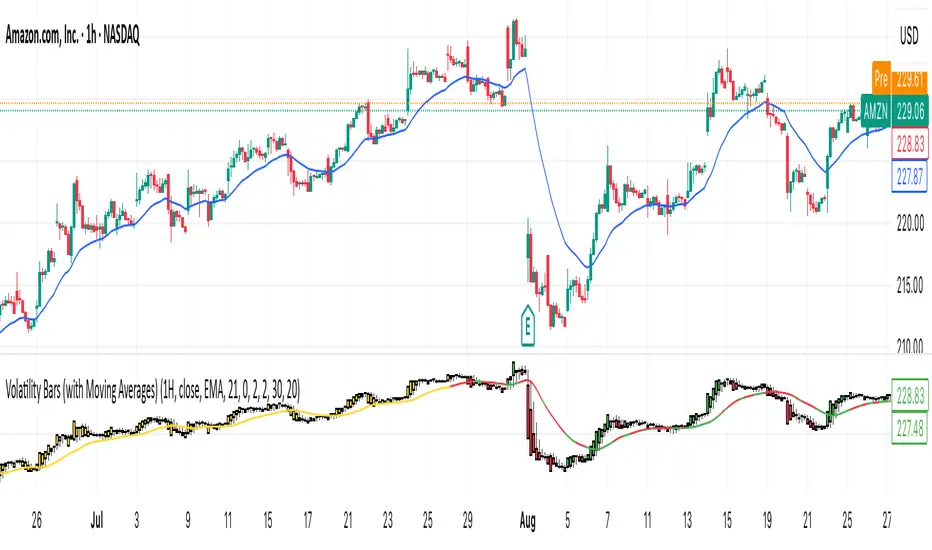
This indicator identifies trending vs. ranging market phases by comparing recent volatility to a prior period using symmetrically weighted moving averages (SWMA).
It compares volatility over two configurable windows (for example 30 vs. 60 days on daily charts) and colors bars to show relative volatility and direction.
Values of C (the volatility ratio) > 1 indicate rising volatility; C < 1 indicate falling volatility.
Recommended timeframes: 1H, 4H, 1D.
How to interpret the colors:
Note: a yellow bar indicates high volatility but does not provide information about the direction of the trend. For this reason I added a moving average for direction reference on main chart.
Practical use (options trading)
I found useful when trading Options, here are some example:
Parameters and behavior:
Two configurable windows (e.g. 30 vs. 60 on daily); the script can adapt window sizes by reference timeframe.
C = recent-window TR sum / prior-window TR sum — a relative volatility ratio.
Color thresholds are adjustable; defaults use 0.75 and 1.25.
Disclaimers:
This indicator provides informational guidance only and is not trading advice.
Backtest strategies and use risk management before applying to live trades.
It compares volatility over two configurable windows (for example 30 vs. 60 days on daily charts) and colors bars to show relative volatility and direction.
Values of C (the volatility ratio) > 1 indicate rising volatility; C < 1 indicate falling volatility.
Recommended timeframes: 1H, 4H, 1D.
How to interpret the colors:
- Yellow: recent volatility much higher than the previous period (C > 1.25). Sign of a significant increase in volatility.
- Silver: recent volatility much lower than the previous period (C < 0.75). Quieter market.
- Green: volatility within the normal range (C between 0.75 and 1.25) and bullish bar (close > open).
- Red: volatility within the normal range and bearish bar (close < open).
Note: a yellow bar indicates high volatility but does not provide information about the direction of the trend. For this reason I added a moving average for direction reference on main chart.
Practical use (options trading)
I found useful when trading Options, here are some example:
- Straddle / Strangle: consider when C is high or rising — you expect large moves but are uncertain of direction.
- Iron Butterfly: consider when C is low or falling and you expect the underlying to remain near a range (benefits from low vol and time decay).
- Iron Condor: consider when volatility is moderate-to-low and you expect limited movement within a wider range (more forgiving than a tight butterfly)
Parameters and behavior:
Two configurable windows (e.g. 30 vs. 60 on daily); the script can adapt window sizes by reference timeframe.
C = recent-window TR sum / prior-window TR sum — a relative volatility ratio.
Color thresholds are adjustable; defaults use 0.75 and 1.25.
Disclaimers:
This indicator provides informational guidance only and is not trading advice.
Backtest strategies and use risk management before applying to live trades.
오픈 소스 스크립트
진정한 트레이딩뷰 정신에 따라 이 스크립트 작성자는 트레이더가 기능을 검토하고 검증할 수 있도록 오픈소스로 공개했습니다. 작성자에게 찬사를 보냅니다! 무료로 사용할 수 있지만 코드를 다시 게시할 경우 하우스 룰이 적용된다는 점을 기억하세요.
면책사항
이 정보와 게시물은 TradingView에서 제공하거나 보증하는 금융, 투자, 거래 또는 기타 유형의 조언이나 권고 사항을 의미하거나 구성하지 않습니다. 자세한 내용은 이용 약관을 참고하세요.
오픈 소스 스크립트
진정한 트레이딩뷰 정신에 따라 이 스크립트 작성자는 트레이더가 기능을 검토하고 검증할 수 있도록 오픈소스로 공개했습니다. 작성자에게 찬사를 보냅니다! 무료로 사용할 수 있지만 코드를 다시 게시할 경우 하우스 룰이 적용된다는 점을 기억하세요.
면책사항
이 정보와 게시물은 TradingView에서 제공하거나 보증하는 금융, 투자, 거래 또는 기타 유형의 조언이나 권고 사항을 의미하거나 구성하지 않습니다. 자세한 내용은 이용 약관을 참고하세요.