OPEN-SOURCE SCRIPT
업데이트됨 Volume Distribution (Heat Map)
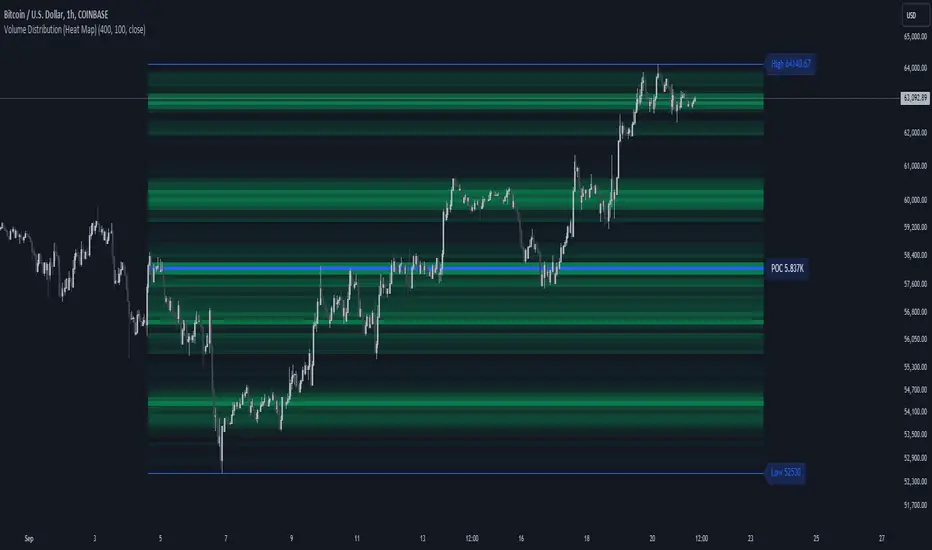
This Pine Script indicator, "Volume Distribution (Heat Map)" is designed to visualize the distribution of volume across different price levels over a specified lookback period. Here's a detailed breakdown of its functionality and features:
Indicator Overview
User Inputs
Logic
The script iterates through the number of bins, calculates the volume for each bin between highest and lowest prices for length period, and updates the corresponding bin in the freq array if the current bar is allowed.
If the current bar is the last bar, the script plots lines and labels based on the volume distribution.
Heatmap Lines:
Solid lines colored based on the volume in each bin, using a gradient from no color to the main color based on amount of volume.

Highest Volume Line:
A dashed red line indicating the bin with the highest volume.

Labels:
Labels for the highest and lowest prices and the volume at the highest volume bin.

Plots
Highest Price Plot: Plots the highest price within the lookback period if the current bar is within the allowed range.
Lowest Price Plot: Plots the lowest price within the lookback period if the current bar is within the allowed range.

Summary
This indicator provides a visual representation of where trading volume is concentrated across different price levels, forming a heatmap. The highest volume level is highlighted with a dashed red line and a label indicating the volume at that level. This can help traders identify significant price levels where trading activity is clustered.
The "Volume Distribution (Heat Map)" indicator is a valuable tool for traders looking to enhance their technical analysis by incorporating volume data into their price charts. It provides a clear and visual representation of where market participants are most active, aiding in better-informed trading decisions.
Indicator Overview
User Inputs
- Length: The lookback period for analysis, defaulting to 500 bars.
- Source: The price source used for calculations (default is the close price).
- Color Intensity: Adjusts the intensity of the heatmap colors, with a default value of 25.
- Lines Width: The width of the plotted lines, with a default value of 10.
- Main Color: The main color used for the heatmap (default is lime).
Logic
The script iterates through the number of bins, calculates the volume for each bin between highest and lowest prices for length period, and updates the corresponding bin in the freq array if the current bar is allowed.
If the current bar is the last bar, the script plots lines and labels based on the volume distribution.
Heatmap Lines:
Solid lines colored based on the volume in each bin, using a gradient from no color to the main color based on amount of volume.
Highest Volume Line:
A dashed red line indicating the bin with the highest volume.
Labels:
Labels for the highest and lowest prices and the volume at the highest volume bin.
Plots
Highest Price Plot: Plots the highest price within the lookback period if the current bar is within the allowed range.
Lowest Price Plot: Plots the lowest price within the lookback period if the current bar is within the allowed range.
Summary
This indicator provides a visual representation of where trading volume is concentrated across different price levels, forming a heatmap. The highest volume level is highlighted with a dashed red line and a label indicating the volume at that level. This can help traders identify significant price levels where trading activity is clustered.
The "Volume Distribution (Heat Map)" indicator is a valuable tool for traders looking to enhance their technical analysis by incorporating volume data into their price charts. It provides a clear and visual representation of where market participants are most active, aiding in better-informed trading decisions.
릴리즈 노트
Fixed Volume Calculation릴리즈 노트
Added Number Of Bins to the User Inputs릴리즈 노트
Updated Volume Calculated Logic릴리즈 노트
- Remastered Logic and Visual of indicator.- Added High and Low Levels
오픈 소스 스크립트
트레이딩뷰의 진정한 정신에 따라, 이 스크립트의 작성자는 이를 오픈소스로 공개하여 트레이더들이 기능을 검토하고 검증할 수 있도록 했습니다. 작성자에게 찬사를 보냅니다! 이 코드는 무료로 사용할 수 있지만, 코드를 재게시하는 경우 하우스 룰이 적용된다는 점을 기억하세요.
면책사항
해당 정보와 게시물은 금융, 투자, 트레이딩 또는 기타 유형의 조언이나 권장 사항으로 간주되지 않으며, 트레이딩뷰에서 제공하거나 보증하는 것이 아닙니다. 자세한 내용은 이용 약관을 참조하세요.
오픈 소스 스크립트
트레이딩뷰의 진정한 정신에 따라, 이 스크립트의 작성자는 이를 오픈소스로 공개하여 트레이더들이 기능을 검토하고 검증할 수 있도록 했습니다. 작성자에게 찬사를 보냅니다! 이 코드는 무료로 사용할 수 있지만, 코드를 재게시하는 경우 하우스 룰이 적용된다는 점을 기억하세요.
면책사항
해당 정보와 게시물은 금융, 투자, 트레이딩 또는 기타 유형의 조언이나 권장 사항으로 간주되지 않으며, 트레이딩뷰에서 제공하거나 보증하는 것이 아닙니다. 자세한 내용은 이용 약관을 참조하세요.