OPEN-SOURCE SCRIPT
High Volume Zone Highlight
Description:
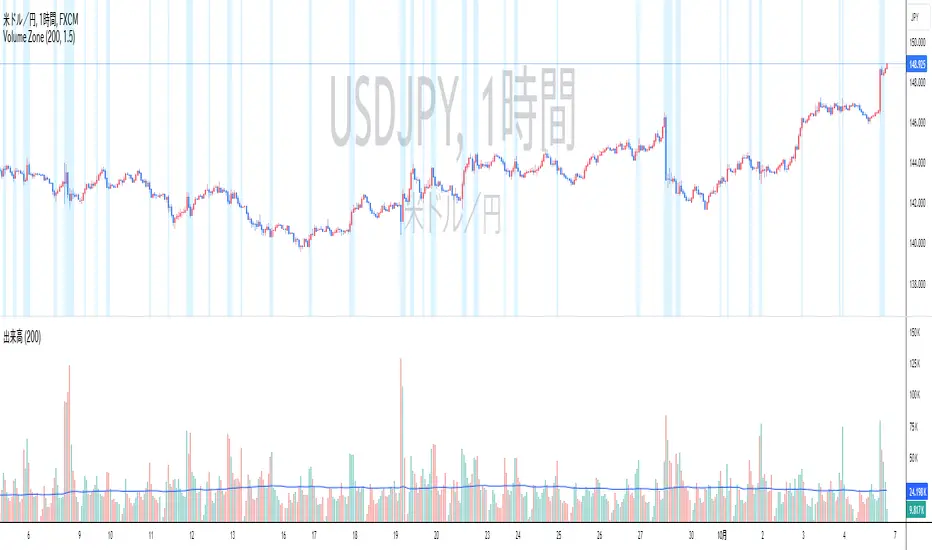
The High Volume Zone Highlight highlights areas on the chart where the volume exceeds a user-defined threshold based on a moving average. This helps traders visually identify zones of high trading activity.
Inputs:
Style Customization:
Users can adjust the color and transparency of the highlighted zones from the settings.
説明:
ハイ・ボリューム・ゾーン・ハイライトは、出来高が移動平均に基づいたユーザー定義の閾値を超えたエリアをチャート上で強調表示します。
設定項目:
スタイルカスタマイズ:
設定からハイライトされたゾーンの色や透明度を調整できます。
The High Volume Zone Highlight highlights areas on the chart where the volume exceeds a user-defined threshold based on a moving average. This helps traders visually identify zones of high trading activity.
- The moving average period and volume threshold are fully customizable.
- Background color highlights appear when the current volume is greater than a specified multiple of the volume moving average.
- Ideal for traders who want to spot significant volume changes relative to historical averages.
Inputs:
- Volume MA Length: The number of periods for calculating the volume moving average.
- Volume MA Factor: A multiplier to define the threshold. For example, setting this to 1.5 will highlight when the volume is 150% of the moving average.
Style Customization:
Users can adjust the color and transparency of the highlighted zones from the settings.
説明:
ハイ・ボリューム・ゾーン・ハイライトは、出来高が移動平均に基づいたユーザー定義の閾値を超えたエリアをチャート上で強調表示します。
- 移動平均期間と出来高閾値は自由にカスタマイズ可能です。
- 現在の出来高が出来高移動平均の指定した倍数を超えた場合、背景色が強調表示されます。
- 過去の平均と比較して重要な出来高の変化を検出したいトレーダーに最適です。
設定項目:
- 出来高移動平均期間:出来高移動平均を計算する際の期間。
- 出来高MA係数: 閾値を定義するための係数。たとえば、1.5に設定すると、出来高が移動平均の150%を超えたときにハイライトされます。
スタイルカスタマイズ:
設定からハイライトされたゾーンの色や透明度を調整できます。
오픈 소스 스크립트
트레이딩뷰의 진정한 정신에 따라, 이 스크립트의 작성자는 이를 오픈소스로 공개하여 트레이더들이 기능을 검토하고 검증할 수 있도록 했습니다. 작성자에게 찬사를 보냅니다! 이 코드는 무료로 사용할 수 있지만, 코드를 재게시하는 경우 하우스 룰이 적용된다는 점을 기억하세요.
면책사항
해당 정보와 게시물은 금융, 투자, 트레이딩 또는 기타 유형의 조언이나 권장 사항으로 간주되지 않으며, 트레이딩뷰에서 제공하거나 보증하는 것이 아닙니다. 자세한 내용은 이용 약관을 참조하세요.
오픈 소스 스크립트
트레이딩뷰의 진정한 정신에 따라, 이 스크립트의 작성자는 이를 오픈소스로 공개하여 트레이더들이 기능을 검토하고 검증할 수 있도록 했습니다. 작성자에게 찬사를 보냅니다! 이 코드는 무료로 사용할 수 있지만, 코드를 재게시하는 경우 하우스 룰이 적용된다는 점을 기억하세요.
면책사항
해당 정보와 게시물은 금융, 투자, 트레이딩 또는 기타 유형의 조언이나 권장 사항으로 간주되지 않으며, 트레이딩뷰에서 제공하거나 보증하는 것이 아닙니다. 자세한 내용은 이용 약관을 참조하세요.