INVITE-ONLY SCRIPT
TIL Volume by Price SR
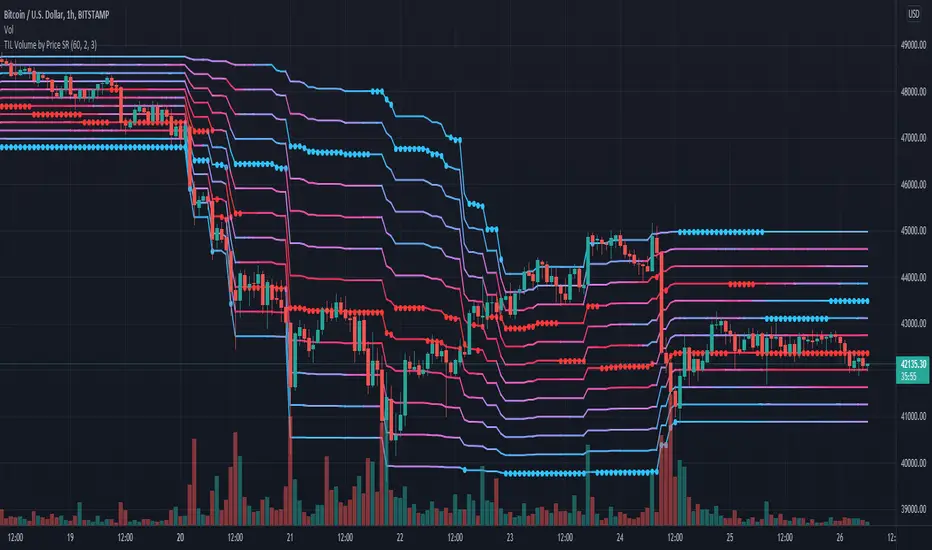
Trading Indicator Lab's Volume by Price SR is a volume-based indicator for TradingView that reveals the strongest (and weakest) support and resistance levels in the chart among 12 price zones within a given period.
How It Works
The Volume by Price indicator uses a spectrum of blue to red colors to differentiate the strength of the volume within a price range for each bar. Think of it as a running volume profile with 12 price zones.
For each bar, the indicator calculates the rank of each price zone from the one that has the least number of volume to the highest within a given length of bars. Price zones that have less volume count are assigned colors that are closer to blue while price zones that have higher volume appear red. The indicator also marks the highest and lowest price levels in the rank with a red and blue dot which correspond to the same color code. The indicator repeats this in the next bar up to the last until it creates a stream of 12 lines that visually represent the gradual shift of volume strength in the price axis.
How to Use
The Volume by Price SR indicator is simple and can be used primarily to gauge support and resistance. Red lines represent price levels where there is a history of higher volume within the period, which also act as good support/resistance levels where price is more likely to be tested or bounce off.
As it can also be seen as a running volume profile indicator, the red and blue dots in each bar can be considered as high volume nodes (HVN) and low volume nodes (LVN) respectively. Though the calculation of the volume profile is continuous, the HVN and LVN dots can often appear consecutively or in a series within a single price level. The price tends to linger around or test lines that has the red dot (HVN). Meanwhile price rarely cross lines with the blue dot (LVN) or not spend as much time in these areas compared to other levels.
The height of the 12 price zones is determined by the difference between the highest high and lowest low of the period which can be useful in visualizing the chart's dynamic price range.
Inputs
- Length - sets the length of the period the indicator calculates for each bar
- Line Thickness - sets the thickness of the 12 lines all at once
- Dot Size - sets the size of the HVN and LVN dots
초대 전용 스크립트
이 스크립트는 작성자가 승인한 사용자만 접근할 수 있습니다. 사용하려면 요청 후 승인을 받아야 하며, 일반적으로 결제 후에 허가가 부여됩니다. 자세한 내용은 아래 작성자의 안내를 따르거나 tradingindicatorlab에게 직접 문의하세요.
트레이딩뷰는 스크립트의 작동 방식을 충분히 이해하고 작성자를 완전히 신뢰하지 않는 이상, 해당 스크립트에 비용을 지불하거나 사용하는 것을 권장하지 않습니다. 커뮤니티 스크립트에서 무료 오픈소스 대안을 찾아보실 수도 있습니다.
작성자 지시 사항
Please feel free to send us a private message here on TradingView to gain access to this indicator.
면책사항
해당 정보와 게시물은 금융, 투자, 트레이딩 또는 기타 유형의 조언이나 권장 사항으로 간주되지 않으며, 트레이딩뷰에서 제공하거나 보증하는 것이 아닙니다. 자세한 내용은 이용 약관을 참조하세요.