OPEN-SOURCE SCRIPT
업데이트됨 FuTech : IPO Lock-in Ends
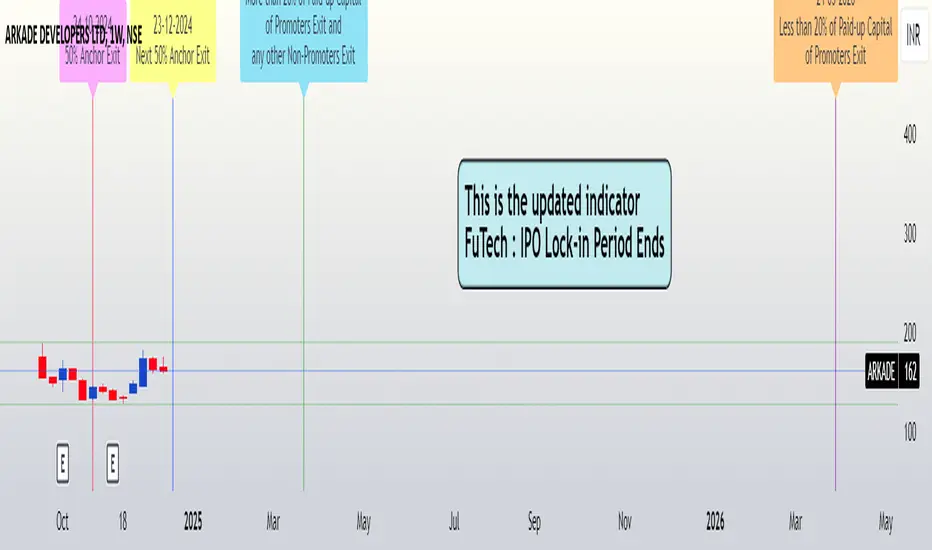
FuTech: Lock-in Ends - First ever unique Indicator on the TradingView platform
Hello Everyone !
Introducing the first-ever unique indicator on the TradingView platform to track the lock-in period expiry dates for IPOs.
The FuTech Lock-in Ends Indicator is specifically designed to assist traders and investors in identifying the key dates when lock-in periods for IPO shares come to an end.
This provides an edge in preparing for potential market movements driven by buying or selling pressures associated with significant share volumes.
=============================================================
Key Features:
1. Tracks Multiple Lock-in Periods:
- Identifies dates when the 30 days, 90 days, 6 months, and 18 months lock-in periods for IPO shares expire.
- Helps traders anticipate potential market action driven by share releases.
2. IPO Lock-in Ends dates as per Compliance with SEBI Guidelines:
- SEBI (Securities and Exchange Board of India) mandates lock-in periods for IPO shares based on investor categories:
- A) Promoters:
- Lock-in period reduced to 18 months for up to 20% of post-issue paid-up capital (previously 3 years).
- For shareholding exceeding 20%, the lock-in period is further reduced to 6 months (previously 1 year).
- B) Anchor Investors:
- 50% of allotted shares: Lock-in period of 90 days from the date of allotment.
- Remaining 50% of shares: Lock-in period of 30 days from the date of allotment.
- C) Non-promoters:
- Lock-in period reduced to 6 months (previously 1 year).
After these lock-in periods end, investors may buy / sell their shares, which can result in significant market activity.
3. Visual Indicator on Charts:
- The indicator draws vertical lines on the TradingView chart at the respective lock-in expiry dates.
- Alerts users in advance about potential market activity due to the release of locked shares.
- Traders can use these alerts to prepare for positions or adjust their existing holdings accordingly.
4. Customizable Settings:
- Users can modify the color of the labels and width of the lines to suit their preferences and enhance chart visibility.
5. User-defined Allotment Dates:
- If the allotment date is known, users can input this information directly. The indicator will then calculate the lock-in period dates based on the provided allotment date, ensuring precise results.
- If no allotment date is entered, the default calculation assumes the allotment date to be three trading days prior to the listing date.
=============================================================
Important Notes:
- Allotment Date Calculation:
- In the absence of user-defined allotment dates, the indicator estimates the allotment date as three trading days prior to the listing date.
- This approximation may deviate by one to two days from the actual event for certain IPOs.
- Proactive Alerts:
- Most dates are intentionally marked 1-2 days in advance to give traders sufficient time to act, whether for taking new positions or squaring off existing ones to avoid unfavorable losses.
=============================================================
The FuTech Lock-in Ends Indicator is a must-have tool for IPO traders and investors looking to stay ahead of market movements. Use it to track key dates and plan your trading strategy effectively with FuTech : Chart is Art.
=============================================================
Thank you !
Jai Swaminarayan Dasna Das !
He Hari ! Bas Ek Tu Raji Tha !
릴리즈 노트
This is Updated Version - (Final)릴리즈 노트
This is now the Updated Indicator, ignore any other similarly published indicatorThis Indicator Link :

(Due to house rules, we cannot delete publicly published scripts, So kindly Ignore earlier Published Indicator and use this indicator only)
오픈 소스 스크립트
트레이딩뷰의 진정한 정신에 따라, 이 스크립트의 작성자는 이를 오픈소스로 공개하여 트레이더들이 기능을 검토하고 검증할 수 있도록 했습니다. 작성자에게 찬사를 보냅니다! 이 코드는 무료로 사용할 수 있지만, 코드를 재게시하는 경우 하우스 룰이 적용된다는 점을 기억하세요.
FuTech: Chart is Art
Request Access for exclusive tools here: t.me/Atmiyabhai
All content by Atmiya_aatubhai is for educational use only
It is not investment advice, nor a buy/sell recommendation
Past performance may not predict future results
Request Access for exclusive tools here: t.me/Atmiyabhai
All content by Atmiya_aatubhai is for educational use only
It is not investment advice, nor a buy/sell recommendation
Past performance may not predict future results
면책사항
해당 정보와 게시물은 금융, 투자, 트레이딩 또는 기타 유형의 조언이나 권장 사항으로 간주되지 않으며, 트레이딩뷰에서 제공하거나 보증하는 것이 아닙니다. 자세한 내용은 이용 약관을 참조하세요.