OPEN-SOURCE SCRIPT
Extension %
업데이트됨
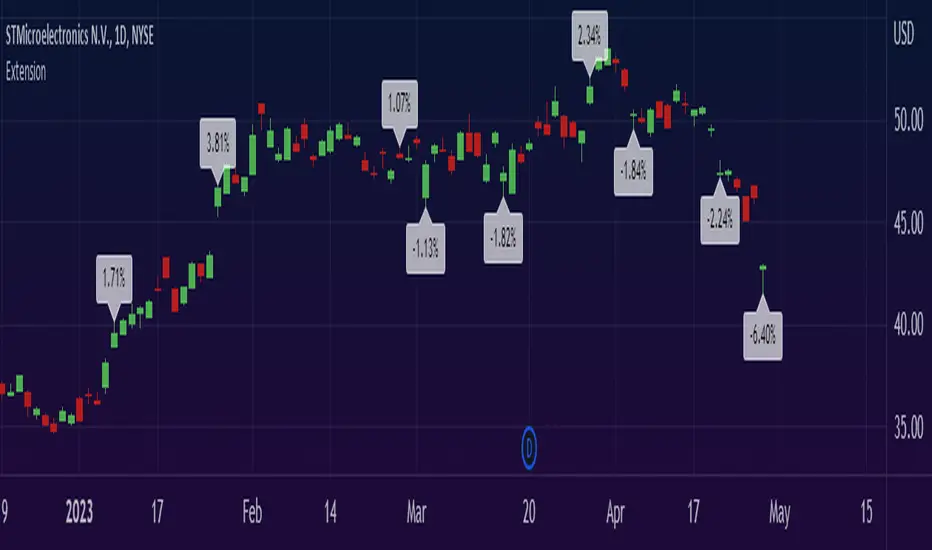
This is a tracking tool to measure two different kinds of distances:
- Gaps, from the open/close or the high/low value to the nearest open/close or high/low value.
- Price extensions of one or two candles from a preferred starting point (open, high, low or close) to a final point (open, high, low or close). The two-candles mode includes an optional rectangle to help you visualize the first and the last point of the measurement.
The script will plot a label with a percentage when the extension reaches the value you set. Unless you choose to track the one-candle price extension, the label will always be displayed on the high/low value of the second candle.
릴리즈 노트
Update:1) On intraday charts, now you can choose to view labels/boxes within a specific time range only.
2) Cleaned, simplified and improved the overall appearance of the code.
릴리즈 노트
Update:1) In the "Price" section, you can now set the number of candles to count and the maximum number of candles to be framed by boxes.
2) Cleaned the code.
릴리즈 노트
(I'm sorry, there was an error with the publication of the chart)릴리즈 노트
UPDATE:Now you can choose to measure the extension in percentage, price, or ticks. On any financial instrument, the script will reproduce the same value as the one calculated by TradingView's Price Range.
릴리즈 노트
UPDATE:1) You now have the flexibility to display extensions in a single direction of your choice.
2) To visually represent the direction of the extension, two distinct colors are at your disposal.
릴리즈 노트
UPDATEAdded the option to view the extension on daily charts on earnings days only, in order to study the historical performance of stock titles.
오픈 소스 스크립트
진정한 TradingView 정신에 따라, 이 스크립트의 저자는 트레이더들이 이해하고 검증할 수 있도록 오픈 소스로 공개했습니다. 저자에게 박수를 보냅니다! 이 코드는 무료로 사용할 수 있지만, 출판물에서 이 코드를 재사용하는 것은 하우스 룰에 의해 관리됩니다. 님은 즐겨찾기로 이 스크립트를 차트에서 쓸 수 있습니다.
면책사항
이 정보와 게시물은 TradingView에서 제공하거나 보증하는 금융, 투자, 거래 또는 기타 유형의 조언이나 권고 사항을 의미하거나 구성하지 않습니다. 자세한 내용은 이용 약관을 참고하세요.