INVITE-ONLY SCRIPT
Axel Smart Trend
Axel Smart Trend is a dynamic system for identifying and tracking market trends.
It combines ATR-based volatility analysis, EMA smoothing, and Fibonacci-anchored zones to show current trend direction and potential reversal areas.

Axel Smart Trend is a dynamic system for identifying and tracking market trends.
It combines ATR-based volatility analysis, EMA smoothing, and Fibonacci-anchored zones to display current trend direction and key reaction areas.
The indicator adapts to changing market volatility, automatically switching between bullish and bearish phases.
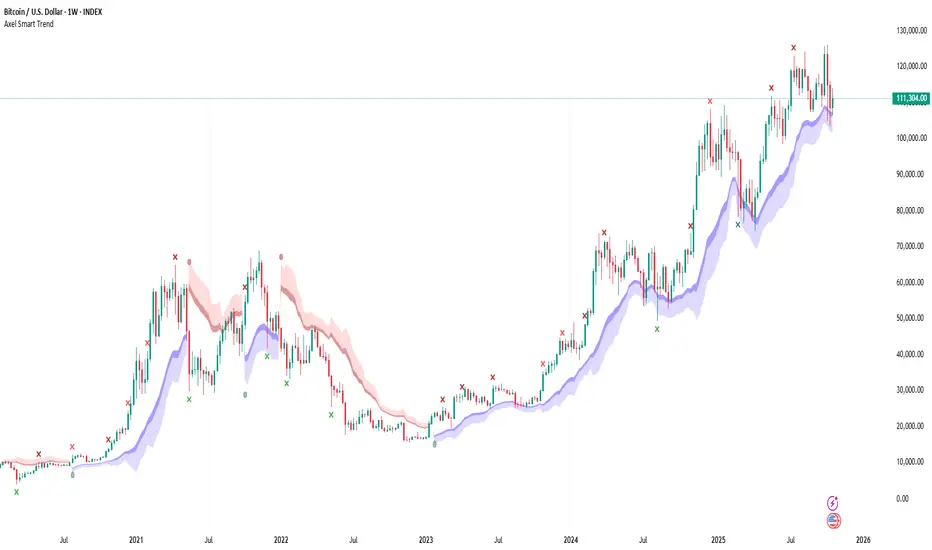
Colored clouds visualize the active trend and act as dynamic support and resistance zones during trend continuation.

Cross markers on the chart highlight moments when the price approaches important cloud levels. These crosses are not buy or sell signals, but rather a visual indication that the market has entered a zone of increased interest.
Main parameters:
The ATR period and multiplier define the sensitivity to volatility.
The EMA length controls the depth of trend smoothing.
Signal strength and cooldown settings adjust the precision and frequency of the markers.
Practical use:
Green crosses tend to appear near potential support areas, while red crosses form near resistance or overbought zones.

The clouds help assess trend strength and possible pullback levels.
Best suited for daily and weekly charts.
Disclaimer:
This indicator is intended for analytical and educational purposes only.
It does not provide financial advice or trading recommendations, and past performance does not guarantee future results.
It combines ATR-based volatility analysis, EMA smoothing, and Fibonacci-anchored zones to show current trend direction and potential reversal areas.
Axel Smart Trend is a dynamic system for identifying and tracking market trends.
It combines ATR-based volatility analysis, EMA smoothing, and Fibonacci-anchored zones to display current trend direction and key reaction areas.
The indicator adapts to changing market volatility, automatically switching between bullish and bearish phases.
Colored clouds visualize the active trend and act as dynamic support and resistance zones during trend continuation.
Cross markers on the chart highlight moments when the price approaches important cloud levels. These crosses are not buy or sell signals, but rather a visual indication that the market has entered a zone of increased interest.
Main parameters:
The ATR period and multiplier define the sensitivity to volatility.
The EMA length controls the depth of trend smoothing.
Signal strength and cooldown settings adjust the precision and frequency of the markers.
Practical use:
Green crosses tend to appear near potential support areas, while red crosses form near resistance or overbought zones.
The clouds help assess trend strength and possible pullback levels.
Best suited for daily and weekly charts.
Disclaimer:
This indicator is intended for analytical and educational purposes only.
It does not provide financial advice or trading recommendations, and past performance does not guarantee future results.
초대 전용 스크립트
이 스크립트는 작성자가 승인한 사용자만 접근할 수 있습니다. 사용하려면 요청을 보내고 승인을 받아야 합니다. 일반적으로 결제 후에 승인이 이루어집니다. 자세한 내용은 아래 작성자의 지침을 따르거나 AxelAlts에게 직접 문의하세요.
트레이딩뷰는 스크립트 작성자를 완전히 신뢰하고 스크립트 작동 방식을 이해하지 않는 한 스크립트 비용을 지불하거나 사용하지 않는 것을 권장하지 않습니다. 무료 오픈소스 대체 스크립트는 커뮤니티 스크립트에서 찾을 수 있습니다.
작성자 지시 사항
To request access, please contact the author — write a short message about yourself and why you need it.
면책사항
이 정보와 게시물은 TradingView에서 제공하거나 보증하는 금융, 투자, 거래 또는 기타 유형의 조언이나 권고 사항을 의미하거나 구성하지 않습니다. 자세한 내용은 이용 약관을 참고하세요.