INVITE-ONLY SCRIPT
업데이트됨 Envious Volume Matrix
"View it all from a different perspective, enter with the hive, stick to your motive, and the further you'll dive." ~ Envious Volume Matrix.
What is unique about this volume indicator compared to others?
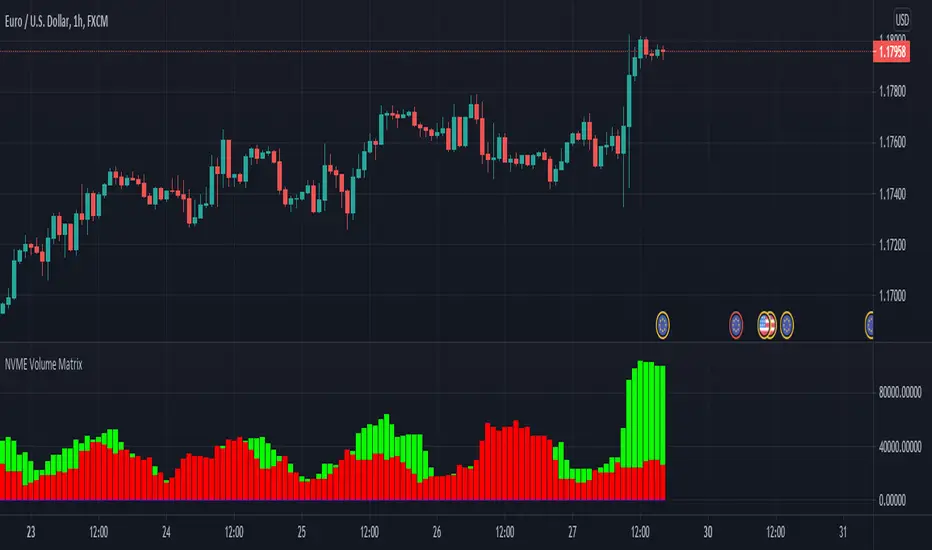
The volume matrix is calculated with different maths and philosophies compared to others and it is combined with some indicators to create the final result. The volume matrix can be used to help see whether or not the bulls or bears are falling or rising so you can see what the next direction of the trend is going to be in. With the volume matrix, you have full control of the indicator. You can customise the timeframe, the colour scheme, the significance of the bull and bear's volume, the plot styles, the dashboard and your alerts. Now that is astonishing!
The volume matrix is to be used as a confluence with your analysis or trading style and should not in anyway shape or form be used as a indication to buy or sell just because the signal says so, it is there to give you a higher chance of having a high probability trade though past results is not indicative of future results and getting access doesn't mean you will become a millionaire in a day as it is not a get rich quick indicator so it won't guarantee 100% success.
Visit our website for more information, which can be found on my profile or on the signature of this indicator!
Does it repaint?
No, our volume matrix doesn't repaint as we do not use any variations where it will cause gaps, future predictions or miscalculations of historic bars.
Does it support all chart types?
Yes, all charts are supported with the volume matrix.
Features:
/Basic Settings
-Enable Custom Timeframe (This will toggle the settings for custom timeframe on and off)
-Custom Timeframe (input box, this will change the timeframe on the indicator to the value set)
-Lookback Period (This period will determine the bar levels needed to validate a calculation)
-Bull's significance (This value will change the strength of the bulls, decreasing the value will make the volume occur faster, increasing the value will make the volume slower)
-Bear's significance (This value will change the strength of the bears, decreasing the value will make the volume occur faster, increasing the value will make the volume slower)
/Miscellaneous
-Volume Styles (Changes the plot style to: Double Lines, Single Line, Histogram, Hills and Valleys, Bar Columns)
-Colour Scheme (Changes the colour scheme to the following options: Ice and Fire, Rhubarb and Custard, Strawberry and Lime, Orange and Purple, Black and White, Old School, Blue and Yellow, Green and Yellow, Purple and
Pink, Heat-O-Meter)
/Dashboard Settings
-Show Volume Dashboard (This will toggle the dashboard on and off)
-Dashboard X-LOC (This will change the x position of the dashboard)
-Text Colour (This will change the text colour of the dashboard)
/Custom Alerts
-Bull Switchover
-Bear Switchover
What is unique about this volume indicator compared to others?
The volume matrix is calculated with different maths and philosophies compared to others and it is combined with some indicators to create the final result. The volume matrix can be used to help see whether or not the bulls or bears are falling or rising so you can see what the next direction of the trend is going to be in. With the volume matrix, you have full control of the indicator. You can customise the timeframe, the colour scheme, the significance of the bull and bear's volume, the plot styles, the dashboard and your alerts. Now that is astonishing!
The volume matrix is to be used as a confluence with your analysis or trading style and should not in anyway shape or form be used as a indication to buy or sell just because the signal says so, it is there to give you a higher chance of having a high probability trade though past results is not indicative of future results and getting access doesn't mean you will become a millionaire in a day as it is not a get rich quick indicator so it won't guarantee 100% success.
Visit our website for more information, which can be found on my profile or on the signature of this indicator!
Does it repaint?
No, our volume matrix doesn't repaint as we do not use any variations where it will cause gaps, future predictions or miscalculations of historic bars.
Does it support all chart types?
Yes, all charts are supported with the volume matrix.
Features:
/Basic Settings
-Enable Custom Timeframe (This will toggle the settings for custom timeframe on and off)
-Custom Timeframe (input box, this will change the timeframe on the indicator to the value set)
-Lookback Period (This period will determine the bar levels needed to validate a calculation)
-Bull's significance (This value will change the strength of the bulls, decreasing the value will make the volume occur faster, increasing the value will make the volume slower)
-Bear's significance (This value will change the strength of the bears, decreasing the value will make the volume occur faster, increasing the value will make the volume slower)
/Miscellaneous
-Volume Styles (Changes the plot style to: Double Lines, Single Line, Histogram, Hills and Valleys, Bar Columns)
-Colour Scheme (Changes the colour scheme to the following options: Ice and Fire, Rhubarb and Custard, Strawberry and Lime, Orange and Purple, Black and White, Old School, Blue and Yellow, Green and Yellow, Purple and
Pink, Heat-O-Meter)
/Dashboard Settings
-Show Volume Dashboard (This will toggle the dashboard on and off)
-Dashboard X-LOC (This will change the x position of the dashboard)
-Text Colour (This will change the text colour of the dashboard)
/Custom Alerts
-Bull Switchover
-Bear Switchover
릴리즈 노트
Reworked Full IndicatorBetter Response Time
Better Customisation
Added 10 Bars of Forecasting [Predicting Future Volume Bars]
Added Anomaly Detector
Changed Internal Name to NVME Volume Matrix
초대 전용 스크립트
이 스크립트는 작성자가 승인한 사용자만 접근할 수 있습니다. 사용하려면 요청 후 승인을 받아야 하며, 일반적으로 결제 후에 허가가 부여됩니다. 자세한 내용은 아래 작성자의 안내를 따르거나 Crypto_Samm에게 직접 문의하세요.
트레이딩뷰는 스크립트의 작동 방식을 충분히 이해하고 작성자를 완전히 신뢰하지 않는 이상, 해당 스크립트에 비용을 지불하거나 사용하는 것을 권장하지 않습니다. 커뮤니티 스크립트에서 무료 오픈소스 대안을 찾아보실 수도 있습니다.
작성자 지시 사항
You will be granted access on TradingView within 2-8 hours after you purchase on our website: https://www.nvmetrading.com We advise you to take a look at our product and discord group before considering using our services! Docs + discord in our website!
Visit our website to get access: nvmetrading.com
You can also find videos, images, documentation and other resources there too.
Join Our Discord: discord.gg/2CY7BYTySR
You can also find videos, images, documentation and other resources there too.
Join Our Discord: discord.gg/2CY7BYTySR
면책사항
해당 정보와 게시물은 금융, 투자, 트레이딩 또는 기타 유형의 조언이나 권장 사항으로 간주되지 않으며, 트레이딩뷰에서 제공하거나 보증하는 것이 아닙니다. 자세한 내용은 이용 약관을 참조하세요.