INVITE-ONLY SCRIPT
업데이트됨 WhaleCrew Overlay
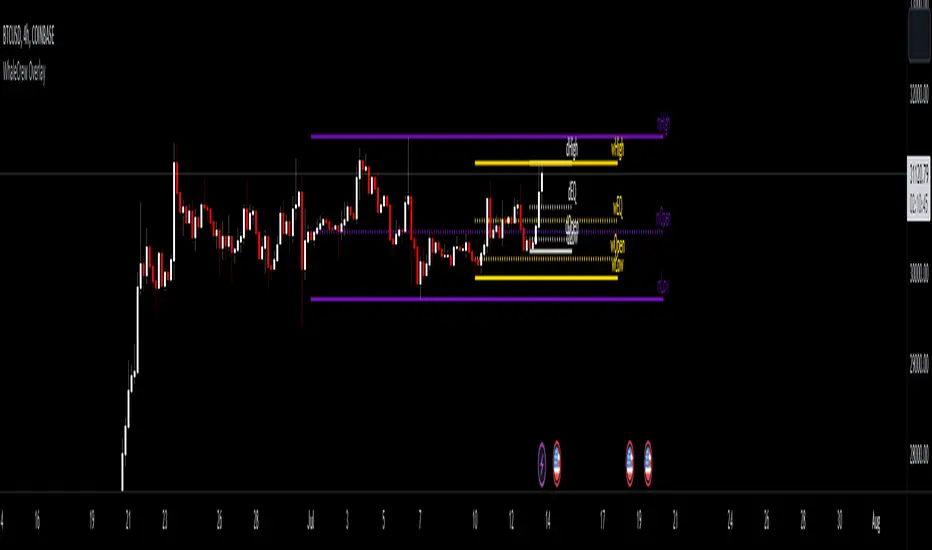
This overlay is all about looking for confluence, and this is achieved by combining the power of Support/Resistance trading and Moving Averages.
Features
Support and Resistance
This involves Daily Levels (High, Low, Open, and Range Center), Weekly Levels (Open, High and Low), as well as the Monthly/Quarterly/Yearly Open.
Automatically having these support/resistance levels on your chart no matter what timeframe you're on is a big advantage, they can be used as confluence levels for potential trades.
Trend Visualization
Our trend component visualizes the current trend using two moving averages. There are multiple inbuilt modes that should be picked based on your trading style.
Use this indicator as confluence and don't rely solely on it.
Fib Ribbons
Our Fib Ribbons are a bundle of multiple EMAs with custom timeframe built-in. Unlike EMA Ribbons our EMA lengths are only based on Fibonacci Numbers.
The numbers of EMAs is four by default (fastest: 8, slowest: 34), but EMA 5 & 55 can be manually enabled.
The ribbons will act as support in an uptrend and as resistance in a downtrend. A ribbon cross often indicates a potential trend change.
Moving Average System
Build a system around 2 custom moving averages for more confluence (supports custom timeframes and many moving average types).
The moving averages can be used for generating signals whenever they cross, or as possible support/resistance.
Intraday Tools
We also support intraday tools like VWAP (Volume-Weighted-Average Price) and TWAP (Time-Weighted-Average-Price).
They differ from normal moving averages by taking volume/time into account and will act as potential support/resistance (commonly used by big market participants).
Usage
You should look for price levels where moving averages and support/resistance are lined up for confluence.
Closely monitor price action near important price levels for potential trade setups:
Access to this indicator can be obtained through our website.
Features
- Support and Resistance
- Trend Visualization
- Fib Ribbons
- Moving Average System
- Intraday Tools
Support and Resistance
This involves Daily Levels (High, Low, Open, and Range Center), Weekly Levels (Open, High and Low), as well as the Monthly/Quarterly/Yearly Open.
Automatically having these support/resistance levels on your chart no matter what timeframe you're on is a big advantage, they can be used as confluence levels for potential trades.
Trend Visualization
Our trend component visualizes the current trend using two moving averages. There are multiple inbuilt modes that should be picked based on your trading style.
Use this indicator as confluence and don't rely solely on it.
Fib Ribbons
Our Fib Ribbons are a bundle of multiple EMAs with custom timeframe built-in. Unlike EMA Ribbons our EMA lengths are only based on Fibonacci Numbers.
The numbers of EMAs is four by default (fastest: 8, slowest: 34), but EMA 5 & 55 can be manually enabled.
The ribbons will act as support in an uptrend and as resistance in a downtrend. A ribbon cross often indicates a potential trend change.
Moving Average System
Build a system around 2 custom moving averages for more confluence (supports custom timeframes and many moving average types).
The moving averages can be used for generating signals whenever they cross, or as possible support/resistance.
Intraday Tools
We also support intraday tools like VWAP (Volume-Weighted-Average Price) and TWAP (Time-Weighted-Average-Price).
They differ from normal moving averages by taking volume/time into account and will act as potential support/resistance (commonly used by big market participants).
Usage
You should look for price levels where moving averages and support/resistance are lined up for confluence.
Closely monitor price action near important price levels for potential trade setups:
- Consolidation right below resistance is considered bullish
- Consolidation right at support might be considered bearish
- Watch out for rejections and retests (also counts for moving averages)
Access to this indicator can be obtained through our website.
릴리즈 노트
Restructured inputs릴리즈 노트
Removed "Trend" section릴리즈 노트
Adjusted default settings릴리즈 노트
Recoded SR Section-fixed dynamic SR levels (daily high/low and range center)
-removed weekly high/low
-adjusted default colors of daily/quarterly/yearly open
릴리즈 노트
Removed Symbols릴리즈 노트
Release of Recode (v1.0.0)초대 전용 스크립트
이 스크립트는 작성자가 승인한 사용자만 접근할 수 있습니다. 사용하려면 요청 후 승인을 받아야 하며, 일반적으로 결제 후에 허가가 부여됩니다. 자세한 내용은 아래 작성자의 안내를 따르거나 WhaleCrew에게 직접 문의하세요.
트레이딩뷰는 스크립트의 작동 방식을 충분히 이해하고 작성자를 완전히 신뢰하지 않는 이상, 해당 스크립트에 비용을 지불하거나 사용하는 것을 권장하지 않습니다. 커뮤니티 스크립트에서 무료 오픈소스 대안을 찾아보실 수도 있습니다.
작성자 지시 사항
Access to this indicator can be obtained through our website.
면책사항
해당 정보와 게시물은 금융, 투자, 트레이딩 또는 기타 유형의 조언이나 권장 사항으로 간주되지 않으며, 트레이딩뷰에서 제공하거나 보증하는 것이 아닙니다. 자세한 내용은 이용 약관을 참조하세요.
초대 전용 스크립트
이 스크립트는 작성자가 승인한 사용자만 접근할 수 있습니다. 사용하려면 요청 후 승인을 받아야 하며, 일반적으로 결제 후에 허가가 부여됩니다. 자세한 내용은 아래 작성자의 안내를 따르거나 WhaleCrew에게 직접 문의하세요.
트레이딩뷰는 스크립트의 작동 방식을 충분히 이해하고 작성자를 완전히 신뢰하지 않는 이상, 해당 스크립트에 비용을 지불하거나 사용하는 것을 권장하지 않습니다. 커뮤니티 스크립트에서 무료 오픈소스 대안을 찾아보실 수도 있습니다.
작성자 지시 사항
Access to this indicator can be obtained through our website.
면책사항
해당 정보와 게시물은 금융, 투자, 트레이딩 또는 기타 유형의 조언이나 권장 사항으로 간주되지 않으며, 트레이딩뷰에서 제공하거나 보증하는 것이 아닙니다. 자세한 내용은 이용 약관을 참조하세요.