INVITE-ONLY SCRIPT
업데이트됨 VR Crayons (Signals, Trend and Reversal Indicator)
This indicator is a combination of many different basic technical analysis tools, such as RSI, Bollinger Bands, Moving Averages and others.
It's main goal is to provide a fast and reliable visual representation of the current price action and possible entry and exit points for trades.
Explanation of the individual functions:
The indicator includes 2 different functions:
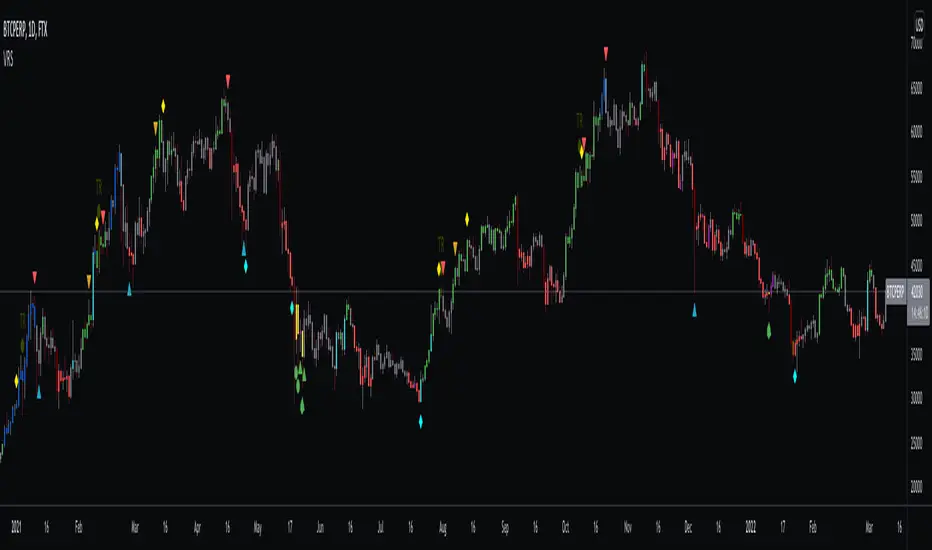
1) The crayons (colors of the candles) show the current state of price action and trend
and can be used to find oversold or overbought areas as well price reversal points.
The colors can be turned off and/or changed in the settings.
2) The signals that can be used to enter or exit trades. There are 4 different types of signals:
Mini signals, high/low timeframe signals and special signals.
All of them can be turned on and off in the settings.
Further explanations
Crayons:
There are 3 general colors, gray, green and red.
There are also multiple other colors to visualize special situations:
Lastly there are two special candle colors, dark red and light blue.
Those are volume weighted indicators of heavy dumping/pumping. I implemented them to signal higher than
average volume which dan be useful when looking for breakouts/-downs or to avoid fomoing into huge pumps or dumps
Signals:
As mentioned above, there are 4 different signal categories.
Signals for Lower Timeframes (5-30m) and Higher Timeframes (1h-D), special signals working on all timeframes
and mini signals which can be taken as TP points but also as entry points for trades.
The placement of the signals shows if it's a "BUY" (below the candles) or a "SELL" (above the candles).
Even-though signals are named "LTF signals", from my experience they can be used on all timeframes.
HTF signals do not work as good on lower timeframes.
For the best visualisation, disable candle borders in settings and turn the wick color to gray.
!! DISCLAIMER !!
All of these signals and bar colors are just visual helpers to find possible entry and exit points for your trades
and to get a quick overview of the current market conditions.
I would always recommend to use at least some basic technical analysis in combination.
And as always in trading, please use proper risk management! None of these signals can an will be 100% accurate!
!! All of these signals and colors are only valid AFTER candle close !!
!! This indicator is NOT repainting !!
Please don't use the comment section to ask for access to this indicator, you can always write me a PM.


It's main goal is to provide a fast and reliable visual representation of the current price action and possible entry and exit points for trades.
Explanation of the individual functions:
The indicator includes 2 different functions:
1) The crayons (colors of the candles) show the current state of price action and trend
and can be used to find oversold or overbought areas as well price reversal points.
The colors can be turned off and/or changed in the settings.
2) The signals that can be used to enter or exit trades. There are 4 different types of signals:
Mini signals, high/low timeframe signals and special signals.
All of them can be turned on and off in the settings.
Further explanations
Crayons:
There are 3 general colors, gray, green and red.
- Red signals a general downtrend,
- Green a general uptrend,
- Gray sideways action.
There are also multiple other colors to visualize special situations:
- Blue signals overbought areas
- Orange signals oversold areas
- Yellow and purple signalling heavy oversold areas and a possible trend reversal to the upside
- Dark Green signals heavy overbought areas and a possible trend reversal to the downside (Also marked with "R")
Lastly there are two special candle colors, dark red and light blue.
Those are volume weighted indicators of heavy dumping/pumping. I implemented them to signal higher than
average volume which dan be useful when looking for breakouts/-downs or to avoid fomoing into huge pumps or dumps
Signals:
As mentioned above, there are 4 different signal categories.
Signals for Lower Timeframes (5-30m) and Higher Timeframes (1h-D), special signals working on all timeframes
and mini signals which can be taken as TP points but also as entry points for trades.
The placement of the signals shows if it's a "BUY" (below the candles) or a "SELL" (above the candles).
Even-though signals are named "LTF signals", from my experience they can be used on all timeframes.
HTF signals do not work as good on lower timeframes.
For the best visualisation, disable candle borders in settings and turn the wick color to gray.
!! DISCLAIMER !!
All of these signals and bar colors are just visual helpers to find possible entry and exit points for your trades
and to get a quick overview of the current market conditions.
I would always recommend to use at least some basic technical analysis in combination.
And as always in trading, please use proper risk management! None of these signals can an will be 100% accurate!
!! All of these signals and colors are only valid AFTER candle close !!
!! This indicator is NOT repainting !!
Please don't use the comment section to ask for access to this indicator, you can always write me a PM.
릴리즈 노트
After feedback from users I decided to switch up the Buy/Sell symbols to make the meaning more obvious. In short:
All symbols above the candles are Sell/Short signals
All symbols below the candles are Buy/Long signals
From my experience and testing:
Green and Red "L/S"s are work best on lower timeframes (15min-2h) but work also on higher timeframes
esp. when prices dump or pump very hard.
Blue and Orange "L/S"s are meant to be used on higher trimeframes, the alogrithm uses mostly filtered moving averages and on current settings
it's designed for timeframes 4h or more.
The small red and green triangles work on all timeframes but are more meant to be "take profit" points rather than entries. If other technical analysis
suggests a good entry, you can use these as a secondary method for more confidence.
The purble "L" is a special buy/long signal designed to catch deep wicks/dumps to get confidence when to buy into a dip.
릴리즈 노트
* Added new Alert Conditions to all signals and bar colors. * Minor improvements to signal conditions.
릴리즈 노트
Added alert conditions for volume pump / dump candles per user request.릴리즈 노트
Small change before a bigger overhaul.* Changed the style of the signals to a more sleek look
* Removed the purple Long because it was just to unreliable imo
릴리즈 노트
* Optimized parameters to improve accuracy of signals* Changed visuals because of mobile issues
* Removed "Special signal" because of inaccuracy
릴리즈 노트
* Just updated the picture 초대 전용 스크립트
이 스크립트는 작성자가 승인한 사용자만 접근할 수 있습니다. 사용하려면 요청 후 승인을 받아야 하며, 일반적으로 결제 후에 허가가 부여됩니다. 자세한 내용은 아래 작성자의 안내를 따르거나 ru0ka에게 직접 문의하세요.
트레이딩뷰는 스크립트의 작동 방식을 충분히 이해하고 작성자를 완전히 신뢰하지 않는 이상, 해당 스크립트에 비용을 지불하거나 사용하는 것을 권장하지 않습니다. 커뮤니티 스크립트에서 무료 오픈소스 대안을 찾아보실 수도 있습니다.
작성자 지시 사항
To get access to this indicator please write me a private message here or on twitter @vincentruoka or visit:
https://www.patreon.com/vincentruoka
면책사항
해당 정보와 게시물은 금융, 투자, 트레이딩 또는 기타 유형의 조언이나 권장 사항으로 간주되지 않으며, 트레이딩뷰에서 제공하거나 보증하는 것이 아닙니다. 자세한 내용은 이용 약관을 참조하세요.
초대 전용 스크립트
이 스크립트는 작성자가 승인한 사용자만 접근할 수 있습니다. 사용하려면 요청 후 승인을 받아야 하며, 일반적으로 결제 후에 허가가 부여됩니다. 자세한 내용은 아래 작성자의 안내를 따르거나 ru0ka에게 직접 문의하세요.
트레이딩뷰는 스크립트의 작동 방식을 충분히 이해하고 작성자를 완전히 신뢰하지 않는 이상, 해당 스크립트에 비용을 지불하거나 사용하는 것을 권장하지 않습니다. 커뮤니티 스크립트에서 무료 오픈소스 대안을 찾아보실 수도 있습니다.
작성자 지시 사항
To get access to this indicator please write me a private message here or on twitter @vincentruoka or visit:
https://www.patreon.com/vincentruoka
면책사항
해당 정보와 게시물은 금융, 투자, 트레이딩 또는 기타 유형의 조언이나 권장 사항으로 간주되지 않으며, 트레이딩뷰에서 제공하거나 보증하는 것이 아닙니다. 자세한 내용은 이용 약관을 참조하세요.