OPEN-SOURCE SCRIPT
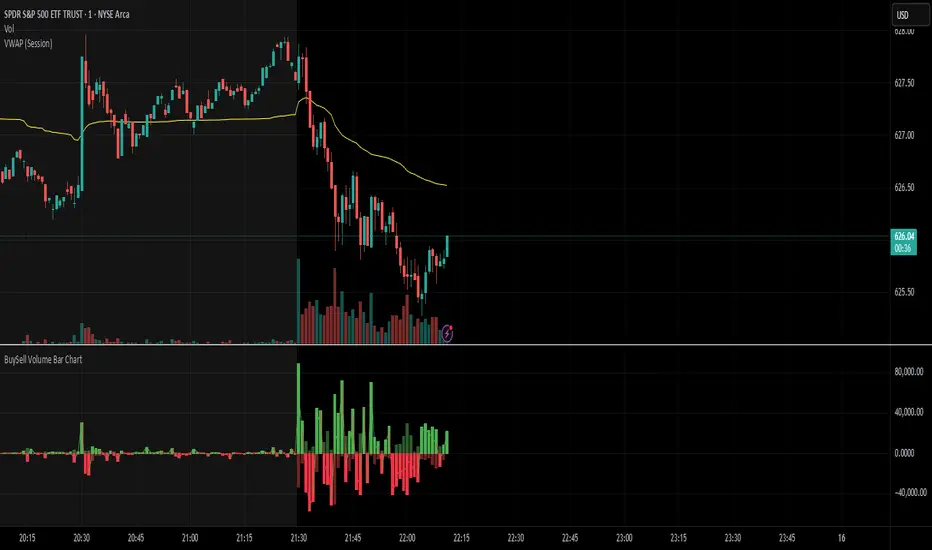
BuySell Volume Bar Chart

• Separates estimated Buy and Sell volume per bar using price action logic
• Plots them in a dual-axis format: buy volume goes up, sell volume goes down
• Colors are dynamic — whichever side dominates gets the stronger color, the weaker side is shaded
• Includes a live difference metric (Δ Volume) as a third value in the indicator title
• Automatically filters out flat/no-move bars to avoid misleading spikes
The live difference metric ("Δ Volume") can be controlled.
This metric calculates the difference between the buying and selling volume live, where it takes the Buy Volume - Sell Volume.
This difference is then displayed in either green (BV > SV) or red (SV > BV). You can toggle it on/off by entering the indicator's settings or double tapping the indicator name on the TV chart.
Another pretty cool thing is the modular colors - you can customize your candle colors and shades to your liking within the code!
오픈 소스 스크립트
트레이딩뷰의 진정한 정신에 따라, 이 스크립트의 작성자는 이를 오픈소스로 공개하여 트레이더들이 기능을 검토하고 검증할 수 있도록 했습니다. 작성자에게 찬사를 보냅니다! 이 코드는 무료로 사용할 수 있지만, 코드를 재게시하는 경우 하우스 룰이 적용된다는 점을 기억하세요.
면책사항
해당 정보와 게시물은 금융, 투자, 트레이딩 또는 기타 유형의 조언이나 권장 사항으로 간주되지 않으며, 트레이딩뷰에서 제공하거나 보증하는 것이 아닙니다. 자세한 내용은 이용 약관을 참조하세요.
오픈 소스 스크립트
트레이딩뷰의 진정한 정신에 따라, 이 스크립트의 작성자는 이를 오픈소스로 공개하여 트레이더들이 기능을 검토하고 검증할 수 있도록 했습니다. 작성자에게 찬사를 보냅니다! 이 코드는 무료로 사용할 수 있지만, 코드를 재게시하는 경우 하우스 룰이 적용된다는 점을 기억하세요.
면책사항
해당 정보와 게시물은 금융, 투자, 트레이딩 또는 기타 유형의 조언이나 권장 사항으로 간주되지 않으며, 트레이딩뷰에서 제공하거나 보증하는 것이 아닙니다. 자세한 내용은 이용 약관을 참조하세요.