OPEN-SOURCE SCRIPT
PhantomFlow AccumulationDetector
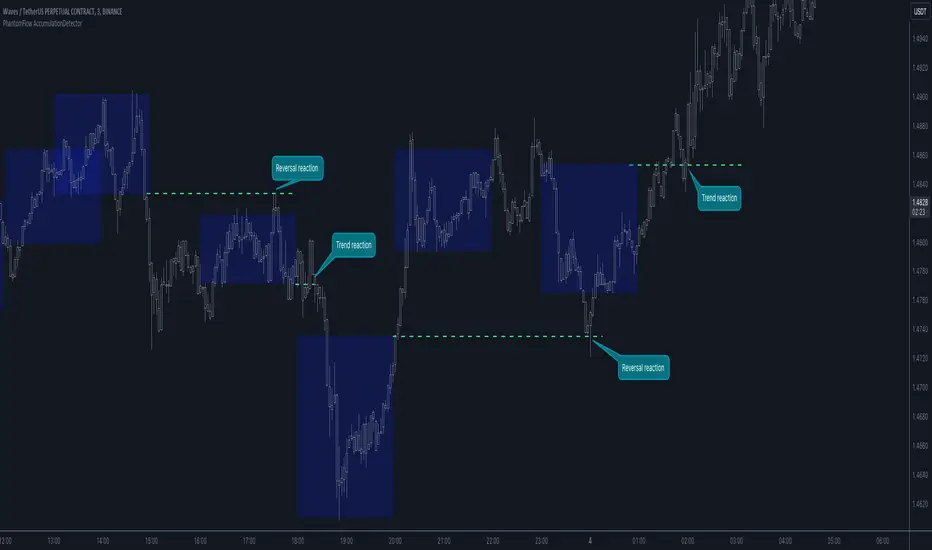
The PhantomFlow AccumulationDetector indicator analyzes the volume profile and displays potential accumulation based on the selected timeframe in the settings. This indicator can be used both as zones for trend following and for identifying reversals, as shown in the examples on the chart. The logic behind the formation of the accumulation zone is based on the fact that the POC (Point of Control) of the current zone is within the Volume Area range of the previous period.
Optimal settings for the working timeframe should be chosen visually, and the size of the zones should not be too large or too small. Additionally, it's advisable not to consider overly wide zones during increased volatility.
Consecutive zones within the same range often indicate a potential reversal.
We borrowed the volume profile calculation code from @LonesomeTheBlue. Thank you for the work done!
오픈 소스 스크립트
트레이딩뷰의 진정한 정신에 따라, 이 스크립트의 작성자는 이를 오픈소스로 공개하여 트레이더들이 기능을 검토하고 검증할 수 있도록 했습니다. 작성자에게 찬사를 보냅니다! 이 코드는 무료로 사용할 수 있지만, 코드를 재게시하는 경우 하우스 룰이 적용된다는 점을 기억하세요.
면책사항
해당 정보와 게시물은 금융, 투자, 트레이딩 또는 기타 유형의 조언이나 권장 사항으로 간주되지 않으며, 트레이딩뷰에서 제공하거나 보증하는 것이 아닙니다. 자세한 내용은 이용 약관을 참조하세요.
오픈 소스 스크립트
트레이딩뷰의 진정한 정신에 따라, 이 스크립트의 작성자는 이를 오픈소스로 공개하여 트레이더들이 기능을 검토하고 검증할 수 있도록 했습니다. 작성자에게 찬사를 보냅니다! 이 코드는 무료로 사용할 수 있지만, 코드를 재게시하는 경우 하우스 룰이 적용된다는 점을 기억하세요.
면책사항
해당 정보와 게시물은 금융, 투자, 트레이딩 또는 기타 유형의 조언이나 권장 사항으로 간주되지 않으며, 트레이딩뷰에서 제공하거나 보증하는 것이 아닙니다. 자세한 내용은 이용 약관을 참조하세요.