INVITE-ONLY SCRIPT
업데이트됨 Tick Plus
Tick Plus
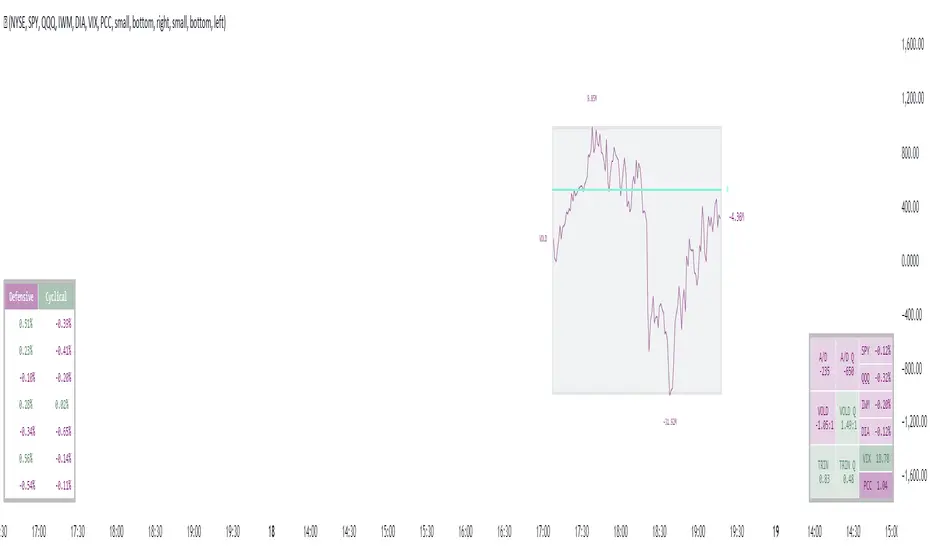
Tick+ is an all-in-one market internals dashboard.
Tick+ features a real-time NYSE or NASDAQ Tick chart, a dynamic Advancers/Decliners vs. VOLD chart, a market internals table readout including both NYSE and NASDAQ instruments, defensive and cyclical sector’s, and daily inflow/out analysis. Also included are customizable symbols readouts, so you can keep an eye on securities that are important to you!
The Tick chart displays a candlestick TICK chart for your chosen exchange and keeps track of the current day's high tick and low tick. Drawn behind these are our Key Reversal Zones.
The Advancers/Decliners vs. VOLD chart dynamically scales both instruments together to easily detect divergences that are known to cut the noise from the market and give an accurate indication of the day's trend.
Market Sync Indicator
This is a small but powerful indicator that analyzes the inflow and outflow of each exchange's underlying securities. When all the markets are in harmony, it will print a green or red symbol below the tick chart. We have also included this signal within the internals table labeled “trending,” which is simply the same signal presented in a more apparent area. Alerts can also be set with these signals to take advantage of the system across tickers.
Note: A gray readout indicates that every market is not moving in the same direction at that moment.
This indicator has been made to be customizable to fit your individual layout style! You are able to stack the Tick & Comparison Charts, as well as display the tables vertically or horizontally!
Note: We are measuring % change of symbols from the daily open to current price, this is so you can make an analysis based on today's info.
All of the default settings are our recommended settings.
- Please check the Author Instructions Below for how to gain access to our indicators.
릴리즈 노트
- Fixed an error which causing certain colors to display incorrectly on the Defensive/Cyclical Table.릴리즈 노트
- bug fix for trin color >1 = red, <1 = green릴리즈 노트
-Font Update-Changed Adv/Dec Table to be default on the right.
릴리즈 노트
Color Update, Updated Indicator color Scheme릴리즈 노트
hotfixed an issue where VOLD was not visualizing properly 초대 전용 스크립트
이 스크립트는 작성자가 승인한 사용자만 접근할 수 있습니다. 사용하려면 요청 후 승인을 받아야 하며, 일반적으로 결제 후에 허가가 부여됩니다. 자세한 내용은 아래 작성자의 안내를 따르거나 TheFinancialCloud에게 직접 문의하세요.
트레이딩뷰는 스크립트의 작동 방식을 충분히 이해하고 작성자를 완전히 신뢰하지 않는 이상, 해당 스크립트에 비용을 지불하거나 사용하는 것을 권장하지 않습니다. 커뮤니티 스크립트에서 무료 오픈소스 대안을 찾아보실 수도 있습니다.
작성자 지시 사항
Gain Access to this indicator Here: https://thefinancial.cloud/indicators/
면책사항
해당 정보와 게시물은 금융, 투자, 트레이딩 또는 기타 유형의 조언이나 권장 사항으로 간주되지 않으며, 트레이딩뷰에서 제공하거나 보증하는 것이 아닙니다. 자세한 내용은 이용 약관을 참조하세요.
초대 전용 스크립트
이 스크립트는 작성자가 승인한 사용자만 접근할 수 있습니다. 사용하려면 요청 후 승인을 받아야 하며, 일반적으로 결제 후에 허가가 부여됩니다. 자세한 내용은 아래 작성자의 안내를 따르거나 TheFinancialCloud에게 직접 문의하세요.
트레이딩뷰는 스크립트의 작동 방식을 충분히 이해하고 작성자를 완전히 신뢰하지 않는 이상, 해당 스크립트에 비용을 지불하거나 사용하는 것을 권장하지 않습니다. 커뮤니티 스크립트에서 무료 오픈소스 대안을 찾아보실 수도 있습니다.
작성자 지시 사항
Gain Access to this indicator Here: https://thefinancial.cloud/indicators/
면책사항
해당 정보와 게시물은 금융, 투자, 트레이딩 또는 기타 유형의 조언이나 권장 사항으로 간주되지 않으며, 트레이딩뷰에서 제공하거나 보증하는 것이 아닙니다. 자세한 내용은 이용 약관을 참조하세요.