PROTECTED SOURCE SCRIPT
MACD on Volume (Signal)
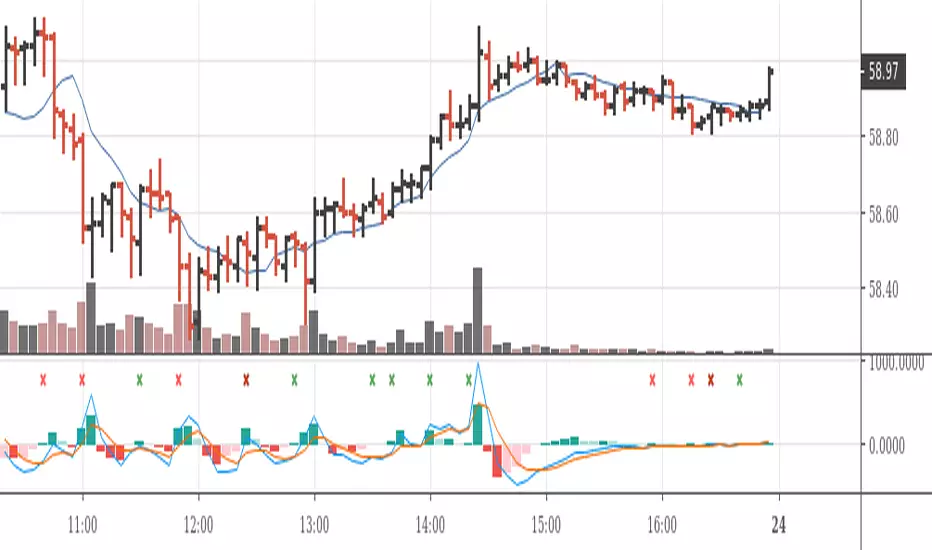
Volume-Price-based 5-min-Chart Trading
Pull up a 5-min chart of your favourite commodity future and stay inside regular trading hours, but show all of globex trading, too.
You will want to base your trading off the 5-min chart on volume and price.
Volume Logic:
The (positive) histogram of your MACD on Pro Rata Volume* indicates market phases with valuable participation. Participate in those phases. Put a horizontal ray on your volume indicator to indicate slow and less than slow volume phases. Stay away from those market phases.
*) Pro Rata Volume = Actual Volume * 300 / elapsed seconds
(Do the platform test. Can you add this indicator to your platform?)
보호된 스크립트입니다
이 스크립트는 비공개 소스로 게시됩니다. 하지만 이를 자유롭게 제한 없이 사용할 수 있습니다 – 자세한 내용은 여기에서 확인하세요.
면책사항
해당 정보와 게시물은 금융, 투자, 트레이딩 또는 기타 유형의 조언이나 권장 사항으로 간주되지 않으며, 트레이딩뷰에서 제공하거나 보증하는 것이 아닙니다. 자세한 내용은 이용 약관을 참조하세요.
면책사항
해당 정보와 게시물은 금융, 투자, 트레이딩 또는 기타 유형의 조언이나 권장 사항으로 간주되지 않으며, 트레이딩뷰에서 제공하거나 보증하는 것이 아닙니다. 자세한 내용은 이용 약관을 참조하세요.