OPEN-SOURCE SCRIPT
업데이트됨 Short Term IndeX
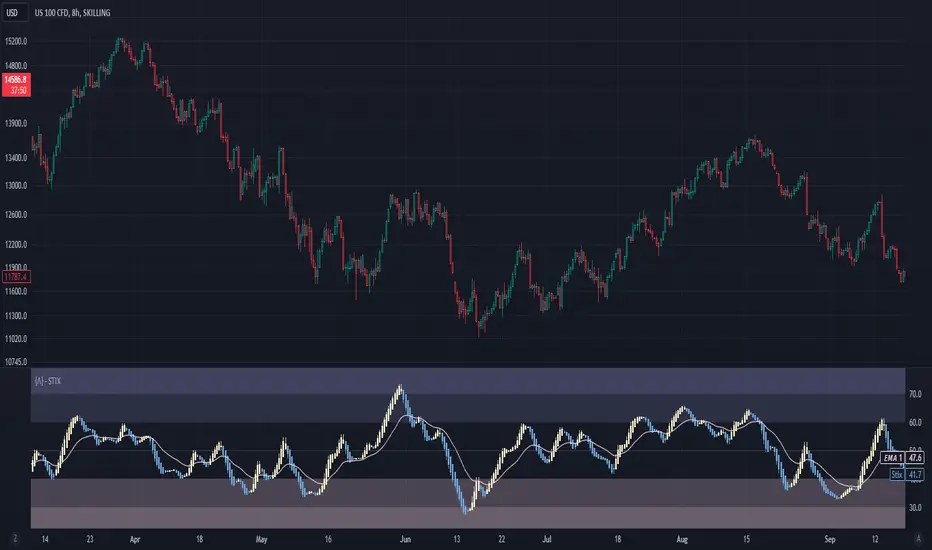
The Short-Term Index (STIX) is a simple market indicator designed to assess short-term overbought or oversold conditions in the stock market. Leveraging a combination of advancing and declining issues, STIX provides valuable insights into market sentiment and potential reversals. To enhance its interpretability and reveal the underlying trend with greater clarity, STIX has been refined through a Heiken-Ashi transformation, ensuring a smoother representation of market dynamics.
Calculation and Methodology:
Pine Script®
STIX is calculated by dividing the difference between the sum of advancing issues (ADV) by the total number of issues traded (ADV + DEC). This quotient is multiplied by 100 to express the result as a percentage. The STIX index ranges from 0 to 100, where extreme values indicate potential overbought (mainly above 60) or oversold (mainly below 40) market conditions.
Heiken-Ashi Transformation:
By applying a Heiken-Ashi transformation to STIX, the indicator gains improved visual clarity and noise reduction. This transformation enhances the ability to identify trend shifts and potential reversal points, making it an even more valuable tool for traders and investors.
Utility and Use Cases:
-The Short-Term Index (STIX) offers a range of practical applications-
1. Overbought/Oversold Conditions: STIX provides a clear indication of short-term overbought or oversold conditions, helping traders anticipate potential market reversals.
2. Reversal Points: STIX can help pinpoint potential reversal points in short-term market trends, providing traders with opportunities to enter or exit positions.

3. Trend Analysis: By observing STIX values over time, traders can assess the strength and sustainability of short-term trends, aiding in trend-following strategies.

The Short-Term Index (STIX), enhanced by its Heiken-Ashi transformation, equips traders and investors with a tool for assessing short-term market conditions, confirming price movements, and identifying potential reversal points. Its robust methodology and refined presentation contribute to a more comprehensive understanding of short-term market dynamics, enabling traders to make well-informed trading decisions.
See Also:
- Other Market Breadth Indicators-


Calculation and Methodology:
stix = ta.ema(adv / (adv + dec) * 100, len)
STIX is calculated by dividing the difference between the sum of advancing issues (ADV) by the total number of issues traded (ADV + DEC). This quotient is multiplied by 100 to express the result as a percentage. The STIX index ranges from 0 to 100, where extreme values indicate potential overbought (mainly above 60) or oversold (mainly below 40) market conditions.
Heiken-Ashi Transformation:
By applying a Heiken-Ashi transformation to STIX, the indicator gains improved visual clarity and noise reduction. This transformation enhances the ability to identify trend shifts and potential reversal points, making it an even more valuable tool for traders and investors.
Utility and Use Cases:
-The Short-Term Index (STIX) offers a range of practical applications-
1. Overbought/Oversold Conditions: STIX provides a clear indication of short-term overbought or oversold conditions, helping traders anticipate potential market reversals.
2. Reversal Points: STIX can help pinpoint potential reversal points in short-term market trends, providing traders with opportunities to enter or exit positions.
3. Trend Analysis: By observing STIX values over time, traders can assess the strength and sustainability of short-term trends, aiding in trend-following strategies.
The Short-Term Index (STIX), enhanced by its Heiken-Ashi transformation, equips traders and investors with a tool for assessing short-term market conditions, confirming price movements, and identifying potential reversal points. Its robust methodology and refined presentation contribute to a more comprehensive understanding of short-term market dynamics, enabling traders to make well-informed trading decisions.
See Also:
- Other Market Breadth Indicators-
릴리즈 노트
Improved code methodology.Added
릴리즈 노트
improved methodology, added support for plot export to new SuperTrend ToolKit오픈 소스 스크립트
트레이딩뷰의 진정한 정신에 따라, 이 스크립트의 작성자는 이를 오픈소스로 공개하여 트레이더들이 기능을 검토하고 검증할 수 있도록 했습니다. 작성자에게 찬사를 보냅니다! 이 코드는 무료로 사용할 수 있지만, 코드를 재게시하는 경우 하우스 룰이 적용된다는 점을 기억하세요.
면책사항
해당 정보와 게시물은 금융, 투자, 트레이딩 또는 기타 유형의 조언이나 권장 사항으로 간주되지 않으며, 트레이딩뷰에서 제공하거나 보증하는 것이 아닙니다. 자세한 내용은 이용 약관을 참조하세요.
오픈 소스 스크립트
트레이딩뷰의 진정한 정신에 따라, 이 스크립트의 작성자는 이를 오픈소스로 공개하여 트레이더들이 기능을 검토하고 검증할 수 있도록 했습니다. 작성자에게 찬사를 보냅니다! 이 코드는 무료로 사용할 수 있지만, 코드를 재게시하는 경우 하우스 룰이 적용된다는 점을 기억하세요.
면책사항
해당 정보와 게시물은 금융, 투자, 트레이딩 또는 기타 유형의 조언이나 권장 사항으로 간주되지 않으며, 트레이딩뷰에서 제공하거나 보증하는 것이 아닙니다. 자세한 내용은 이용 약관을 참조하세요.