OPEN-SOURCE SCRIPT
업데이트됨 Trend Lines
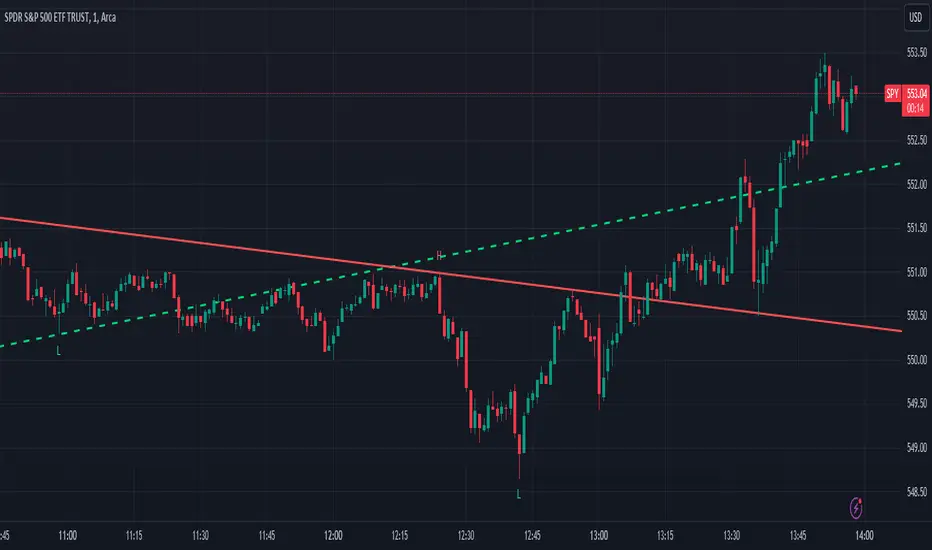
This script, titled "Trend Lines," is designed to detect and plot significant trend lines on a TradingView chart, based on pivot points. It highlights both uptrend and downtrend lines using different colors and allows customization of line styles, including color and thickness. Here's a breakdown of how the script works:
Inputs
Left Bars (lb) and Right Bars (rb): These inputs determine the number of bars to the left and right of a pivot point used to identify significant highs and lows.
Show Pivot Points: A boolean input to display markers at detected pivot points on the chart.
Show Old Line as Dashed: A boolean input to display older trend lines as dashed for visual distinction.
Uptrend Line Color (ucolor) and Downtrend Line Color (dcolor): Color inputs to customize the appearance of uptrend and downtrend lines.
Uptrend Line Thickness (uthickness) and Downtrend Line Thickness (dthickness): Inputs to adjust the thickness of the trend lines.
Calculations
Pivot Highs and Lows: The script calculates potential pivot highs and lows by looking at lb bars to the left and rb bars to the right. If a bar's high is the highest (or low is the lowest) within this window, it is considered a pivot point.
Trend Lines: The script connects the most recent and previous pivot highs to form downtrend lines, and the most recent and previous pivot lows to form uptrend lines. These lines are drawn with the specified color and thickness.
Angles: The angle of each trend line is calculated to determine whether the trend is strengthening or weakening. If the trend changes significantly, the line's extension is adjusted accordingly.
Plotting
Pivot Point Markers: If Show Pivot Points is enabled, markers labeled "H" for highs and "L" for lows are plotted at the pivot points.
Trend Lines: The script draws lines between pivot points, coloring them according to the trend direction (uptrend or downtrend). If Show Old Line as Dashed is enabled, the script sets older lines to a dashed style to indicate they are no longer the most recent trend lines.
This script is useful for traders who want to visually identify key support and resistance levels based on historical price action, helping them to make more informed trading decisions. The customization options allow traders to tailor the appearance of the trend lines to suit their personal preferences or charting style.
릴리즈 노트
Edited title and snapshot.오픈 소스 스크립트
트레이딩뷰의 진정한 정신에 따라, 이 스크립트의 작성자는 이를 오픈소스로 공개하여 트레이더들이 기능을 검토하고 검증할 수 있도록 했습니다. 작성자에게 찬사를 보냅니다! 이 코드는 무료로 사용할 수 있지만, 코드를 재게시하는 경우 하우스 룰이 적용된다는 점을 기억하세요.
면책사항
해당 정보와 게시물은 금융, 투자, 트레이딩 또는 기타 유형의 조언이나 권장 사항으로 간주되지 않으며, 트레이딩뷰에서 제공하거나 보증하는 것이 아닙니다. 자세한 내용은 이용 약관을 참조하세요.
오픈 소스 스크립트
트레이딩뷰의 진정한 정신에 따라, 이 스크립트의 작성자는 이를 오픈소스로 공개하여 트레이더들이 기능을 검토하고 검증할 수 있도록 했습니다. 작성자에게 찬사를 보냅니다! 이 코드는 무료로 사용할 수 있지만, 코드를 재게시하는 경우 하우스 룰이 적용된다는 점을 기억하세요.
면책사항
해당 정보와 게시물은 금융, 투자, 트레이딩 또는 기타 유형의 조언이나 권장 사항으로 간주되지 않으며, 트레이딩뷰에서 제공하거나 보증하는 것이 아닙니다. 자세한 내용은 이용 약관을 참조하세요.