OPEN-SOURCE SCRIPT
Trend Chameleon
The Trend Chameleon, originally developed by Alex Cole for the Bloomberg Terminal, is a powerful tool designed to simplify trend identification and illuminate potential trading opportunities. It leverages a clear visual display to decode market movements, making it useful for traders of all experience levels.
🟠 Overview
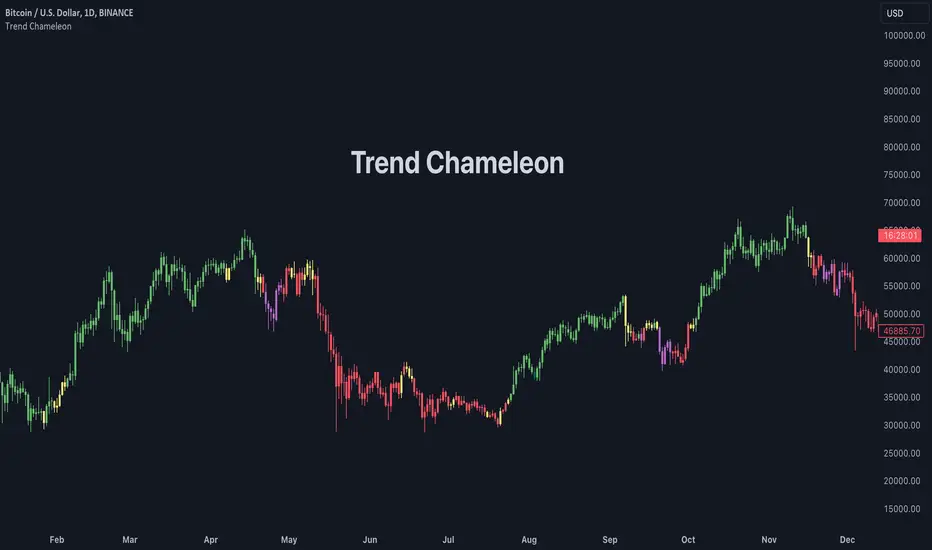
Here's an illustration of how the indicator performs for ES (S&P 500 E-mini Future) on the daily chart:

Trend Chameleon employs a color-coded candle scheme, with each color corresponding to a specific level of trend strength. Purple candles represent the strongest bearish trends, while teal candles signal the most potent bullish momentum. Between these extremes lie red, yellow, and green candles, providing a spectrum of trend direction. This intuitive color coding allows you to quickly grasp the prevailing market sentiment and identify potential entry and exit points for your trades.
🟠 Algorithm
Under the hood, Trend Chameleon evaluates four conditions to provide a directional strength score:
1. Whether the MACD value is positive.
2. Whether the SMA 50 of open prices is above the SMA 50 of the close prices.
3. Whether the ROC indicator value is positive.
4. Whether the current close price is above the SMA 50.
The total number of fulfilled conditions (0 to 4) determines the trend strength, with 0 indicating the most bearish and 4 signifying the strongest bullish trend. This score is then visually represented by coloring the bars on the chart.
🟠 Note
If you don't see the bars being properly colored after adding this indicator, please ensure Trend Chameleon is positioned on top of all other indicators in your chart. This can be easily achieved by hovering over the indicator's name, clicking the three dots, selecting "Visual Order," and then choosing "Bring to front."
🟠 Overview
Here's an illustration of how the indicator performs for ES (S&P 500 E-mini Future) on the daily chart:
Trend Chameleon employs a color-coded candle scheme, with each color corresponding to a specific level of trend strength. Purple candles represent the strongest bearish trends, while teal candles signal the most potent bullish momentum. Between these extremes lie red, yellow, and green candles, providing a spectrum of trend direction. This intuitive color coding allows you to quickly grasp the prevailing market sentiment and identify potential entry and exit points for your trades.
🟠 Algorithm
Under the hood, Trend Chameleon evaluates four conditions to provide a directional strength score:
1. Whether the MACD value is positive.
2. Whether the SMA 50 of open prices is above the SMA 50 of the close prices.
3. Whether the ROC indicator value is positive.
4. Whether the current close price is above the SMA 50.
The total number of fulfilled conditions (0 to 4) determines the trend strength, with 0 indicating the most bearish and 4 signifying the strongest bullish trend. This score is then visually represented by coloring the bars on the chart.
🟠 Note
If you don't see the bars being properly colored after adding this indicator, please ensure Trend Chameleon is positioned on top of all other indicators in your chart. This can be easily achieved by hovering over the indicator's name, clicking the three dots, selecting "Visual Order," and then choosing "Bring to front."
오픈 소스 스크립트
트레이딩뷰의 진정한 정신에 따라, 이 스크립트의 작성자는 이를 오픈소스로 공개하여 트레이더들이 기능을 검토하고 검증할 수 있도록 했습니다. 작성자에게 찬사를 보냅니다! 이 코드는 무료로 사용할 수 있지만, 코드를 재게시하는 경우 하우스 룰이 적용된다는 점을 기억하세요.
专业缠论指标: alphaviz.pro/chanlun
Email: contact@alphaviz.pro
Discord: discord.gg/w2fFtNega4
Email: contact@alphaviz.pro
Discord: discord.gg/w2fFtNega4
면책사항
해당 정보와 게시물은 금융, 투자, 트레이딩 또는 기타 유형의 조언이나 권장 사항으로 간주되지 않으며, 트레이딩뷰에서 제공하거나 보증하는 것이 아닙니다. 자세한 내용은 이용 약관을 참조하세요.