OPEN-SOURCE SCRIPT
Trend Regression Kernel [IkkeOmar]
Kernel by jdehorty huge shoutout to him! This is only an idea for how I use it when trading
All credit for the kernel goes to him, I did not make the kernel! I don't know how to make it more clear.
I use this to assist with top-down analysis.
timeframe I want to trade : timeframe to analyse with white noise and kernel:
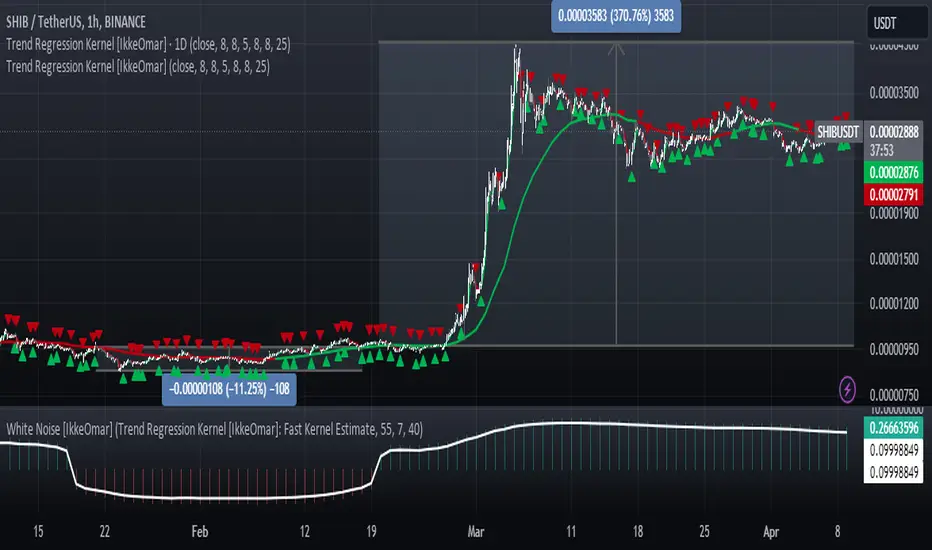
In the chart you see that I have the 1H open, I use the white noise at a "lower setting length" (55 in this case), I change the source of to be the kernel on the higher timeframe. When a new trend is detected by the White noise I wait for price to retest the kernel before building a position. Another case described below:

Here i use the adaptive MCVF (I have made this free for everyone on TradingView) to buy when price is below the kernel while the trend for the white noise is bullish.
Notice that the Kernel is set on the 4H timeframe! The source of the white noise is the kernel!
Here is an example in a bearish trend:

Notice, I am on the 5m chart, kernel uses the 2H chart and the source of the white noise is the kernel.
I use the adaptive MCVF to help me get entries AFTER the first touch of the kernel.
Mandatory code explanation, with respect to the house rules:
It's important to mention that the buy and sell signals from the indicator is very discretionary, I rarely use them, and if I do it's if they are in confluence with a correction i am biased towards or if it has confluence with some of my other systems.
The adaptive MCVF and White noise is free for everyone on TradingView, linked below:)

![Adaptive Momentum Channel - [Volume Filter]](https://s3.tradingview.com/7/7iQxoE9p_mid.png)
Huge shoutout to jdehorty, original kernel below:

All credit for the kernel goes to him, I did not make the kernel! I don't know how to make it more clear.
I use this to assist with top-down analysis.
timeframe I want to trade : timeframe to analyse with white noise and kernel:
- 1m : 1H
- 5m : 2H
- 15m : 4H
- 1H : 1D
In the chart you see that I have the 1H open, I use the white noise at a "lower setting length" (55 in this case), I change the source of to be the kernel on the higher timeframe. When a new trend is detected by the White noise I wait for price to retest the kernel before building a position. Another case described below:
Here i use the adaptive MCVF (I have made this free for everyone on TradingView) to buy when price is below the kernel while the trend for the white noise is bullish.
Notice that the Kernel is set on the 4H timeframe! The source of the white noise is the kernel!
Here is an example in a bearish trend:
Notice, I am on the 5m chart, kernel uses the 2H chart and the source of the white noise is the kernel.
I use the adaptive MCVF to help me get entries AFTER the first touch of the kernel.
Mandatory code explanation, with respect to the house rules:
- Input settings:
Input Settings:
The script provides various input parameters to customize the indicator:
src: The source of price data, defaulted to closing prices.
h, r, x_0: Parameters for Kernel 1.
h2, r2, x_2: Parameters for Kernel 2. - Kernel Regression Functions:
Two functions kernel_regression1 and kernel_regression2 are defined to perform kernel regression calculations.
These functions estimate the trend using the Nadaraya-Watson kernel non-parametric regression method.
They take the source data (_src), the size of the data series (_size), and the lookback window (_h) as inputs.
They iterate over the data series and calculate the weighted sum of the values based on the specified kernel parameters.
The result is divided by the cumulative weight to obtain the estimated value. - Estimations:
The kernel_regression1 and kernel_regression2 functions are called with the respective parameters to estimate trends (yhat1 and yhat2). - Buy and Sell Signals:
Buy and sell signals are generated based on crossover and crossunder conditions between the two trend estimates (yhat1 and yhat2).
buySignal is true when yhat1 crosses above yhat2.
SellSignal is true when yhat1 crosses below yhat2. - Plotting:
The average of the two trend estimates (yhat1 and yhat2) is calculated and plotted.
The color of the plot is determined based on whether yhat1 is greater than yhat2, less than yhat2, or equal to yhat2.
Buy and sell signals are plotted using triangle shapes below and above bars, respectively.
Alerts:
Alert conditions are set based on buy and sell signals. Alerts are triggered when a crossover (long signal) or crossunder (short signal) occurs.
The alerts include information about the signal type, symbol, and price.
It's important to mention that the buy and sell signals from the indicator is very discretionary, I rarely use them, and if I do it's if they are in confluence with a correction i am biased towards or if it has confluence with some of my other systems.
The adaptive MCVF and White noise is free for everyone on TradingView, linked below:)
Huge shoutout to jdehorty, original kernel below:
오픈 소스 스크립트
진정한 TradingView 정신에 따라, 이 스크립트의 저자는 트레이더들이 이해하고 검증할 수 있도록 오픈 소스로 공개했습니다. 저자에게 박수를 보냅니다! 이 코드는 무료로 사용할 수 있지만, 출판물에서 이 코드를 재사용하는 것은 하우스 룰에 의해 관리됩니다. 님은 즐겨찾기로 이 스크립트를 차트에서 쓸 수 있습니다.
Join my community where i share signals and my secret algos:
Telegram:
t.me/ikkeomarfree
I can also pass funded accounts for you!
$50,000 accounts
Just dm my Telegram @IkkeOmar
Telegram:
t.me/ikkeomarfree
I can also pass funded accounts for you!
$50,000 accounts
Just dm my Telegram @IkkeOmar
면책사항
이 정보와 게시물은 TradingView에서 제공하거나 보증하는 금융, 투자, 거래 또는 기타 유형의 조언이나 권고 사항을 의미하거나 구성하지 않습니다. 자세한 내용은 이용 약관을 참고하세요.