OPEN-SOURCE SCRIPT
BUY & SELL VOLUME PRESSURE by @XeL_Arjona
BUY & SELL PRICE TO VOLUME PRESSURE
By Ricardo M Arjona xel_arjona
DISCLAIMER:
The Following indicator/code IS NOT intended to be a formal investment advice or recommendation by the author, nor should be construed as such. Users will be fully responsible by their use regarding their own trading vehicles/assets.
The embedded code and ideas within this work are FREELY AND PUBLICLY available on the Web for NON LUCRATIVE ACTIVITIES and must remain as is.
Pine Script code MOD's and adaptations by xel_arjona with special mention in regard of:
WHAT IS THIS?
The following indicators try to acknowledge in a K-I-S-S approach to the eye (Keep-It-Simple-Stupid), the two most important aspects of nearly every trading vehicle: -- PRICE ACTION IN RELATION BY IT'S VOLUME --
Any important addition to this work MUST REMAIN PUBLIC by means of CreativeCommons CC & TradingView. -- 2015
By Ricardo M Arjona xel_arjona
DISCLAIMER:
The Following indicator/code IS NOT intended to be a formal investment advice or recommendation by the author, nor should be construed as such. Users will be fully responsible by their use regarding their own trading vehicles/assets.
The embedded code and ideas within this work are FREELY AND PUBLICLY available on the Web for NON LUCRATIVE ACTIVITIES and must remain as is.
Pine Script code MOD's and adaptations by xel_arjona with special mention in regard of:
- Buy (Bull) and Sell (Bear) "Power Balance Algorithm" by: Stocks & Commodities V. 21:10 (68-72): "Bull And Bear Balance Indicator by Vadim Gimelfarb"
- Normalisation (Filter) from Karthik Marar's VSA work: karthikmarar.blogspot.mx
- Buy to Sell Convergence / Divergence and Volume Pressure Counterforce Histogram Ideas by: xel_arjona
WHAT IS THIS?
The following indicators try to acknowledge in a K-I-S-S approach to the eye (Keep-It-Simple-Stupid), the two most important aspects of nearly every trading vehicle: -- PRICE ACTION IN RELATION BY IT'S VOLUME --
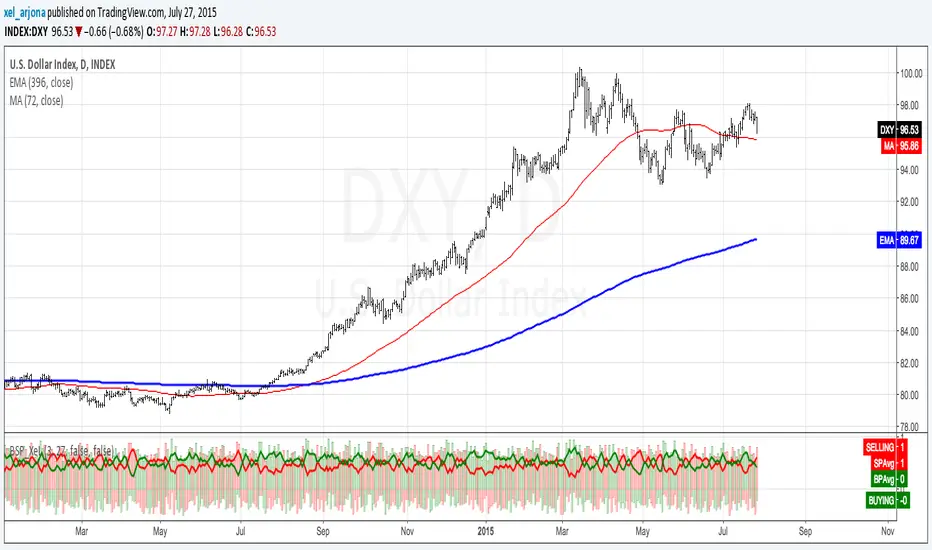
- Volume Pressure Histogram: Columns plotted in positive are considered the dominant Volume Force for the given period. All "negative" columns represents the counterforce Vol.Press against the dominant.
- Buy to Sell Convergence / Divergence: It's a simple adaptation of the popular "Price Percentage Oscillator" or MACD but taking Buying Pressure against Selling Pressure Averages, so given a Positive oscillator reading (>0) represents Bullish dominant Trend and a Negative reading (<0) a Bearish dominant Trend. Histogram is the diff between RAW Volume Pressures Convergence/Divergence minus Normalised ones (Signal) which helps as a confirmation.
- Volume bars are by default plotted from RAW Volume Pressure algorithms, but they can be as well filtered with Karthik Marar's approach against a "Total Volume Average" in favor to clean day to day noise like HFT.
- ALL NEW IDEAS OR MODIFICATIONS to these indicators are Welcome in favor to deploy a better and more accurate readings. I will be very glad to be notified at Twitter: xel_arjona
Any important addition to this work MUST REMAIN PUBLIC by means of CreativeCommons CC & TradingView. -- 2015
오픈 소스 스크립트
트레이딩뷰의 진정한 정신에 따라, 이 스크립트의 작성자는 이를 오픈소스로 공개하여 트레이더들이 기능을 검토하고 검증할 수 있도록 했습니다. 작성자에게 찬사를 보냅니다! 이 코드는 무료로 사용할 수 있지만, 코드를 재게시하는 경우 하우스 룰이 적용된다는 점을 기억하세요.
면책사항
해당 정보와 게시물은 금융, 투자, 트레이딩 또는 기타 유형의 조언이나 권장 사항으로 간주되지 않으며, 트레이딩뷰에서 제공하거나 보증하는 것이 아닙니다. 자세한 내용은 이용 약관을 참조하세요.
오픈 소스 스크립트
트레이딩뷰의 진정한 정신에 따라, 이 스크립트의 작성자는 이를 오픈소스로 공개하여 트레이더들이 기능을 검토하고 검증할 수 있도록 했습니다. 작성자에게 찬사를 보냅니다! 이 코드는 무료로 사용할 수 있지만, 코드를 재게시하는 경우 하우스 룰이 적용된다는 점을 기억하세요.
면책사항
해당 정보와 게시물은 금융, 투자, 트레이딩 또는 기타 유형의 조언이나 권장 사항으로 간주되지 않으며, 트레이딩뷰에서 제공하거나 보증하는 것이 아닙니다. 자세한 내용은 이용 약관을 참조하세요.