OPEN-SOURCE SCRIPT
업데이트됨 Cumulative Volume Delta with EMA Plot
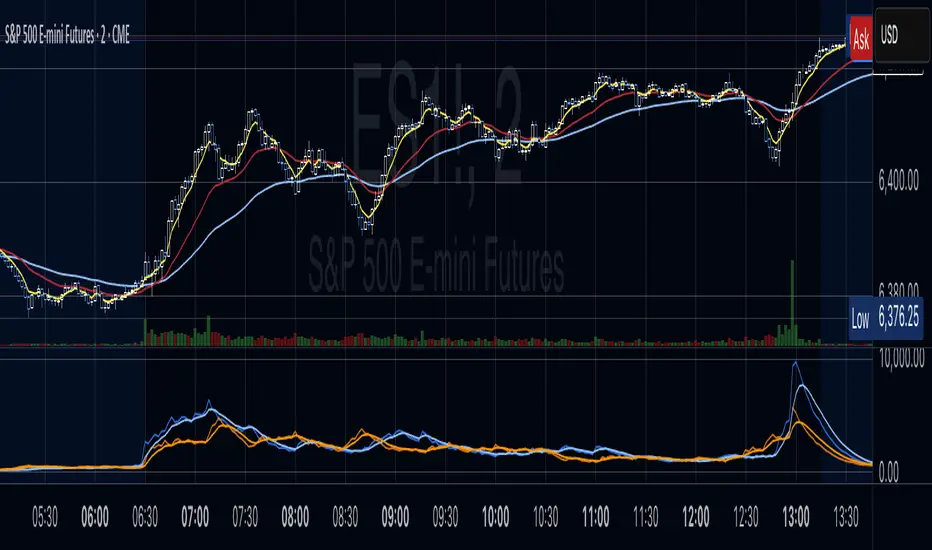
Cumulative Delta Volume is a key tool for analyzing the relationship between trading volume and price movement, often referred to as Volume Price Action.
In this indicator, an Exponential Moving Average (EMA) is applied to smooth out short-term noise and reduce volatility, making trends easier to identify. Traders can watch for EMA crossovers as confirmation signals for potential trend reversals, as well as buying or selling opportunities.
In this indicator, an Exponential Moving Average (EMA) is applied to smooth out short-term noise and reduce volatility, making trends easier to identify. Traders can watch for EMA crossovers as confirmation signals for potential trend reversals, as well as buying or selling opportunities.
릴리즈 노트
Cumulative Delta Volume is a key tool for analyzing the relationship between trading volume and price movement, often referred to as Volume Price Action.In this indicator, an Exponential Moving Average (EMA) is applied to smooth out short-term noise and reduce volatility, making trends easier to identify. Traders can watch for EMA crossovers as confirmation signals for potential trend reversals, as well as buying or selling opportunities.
오픈 소스 스크립트
트레이딩뷰의 진정한 정신에 따라, 이 스크립트의 작성자는 이를 오픈소스로 공개하여 트레이더들이 기능을 검토하고 검증할 수 있도록 했습니다. 작성자에게 찬사를 보냅니다! 이 코드는 무료로 사용할 수 있지만, 코드를 재게시하는 경우 하우스 룰이 적용된다는 점을 기억하세요.
면책사항
해당 정보와 게시물은 금융, 투자, 트레이딩 또는 기타 유형의 조언이나 권장 사항으로 간주되지 않으며, 트레이딩뷰에서 제공하거나 보증하는 것이 아닙니다. 자세한 내용은 이용 약관을 참조하세요.
오픈 소스 스크립트
트레이딩뷰의 진정한 정신에 따라, 이 스크립트의 작성자는 이를 오픈소스로 공개하여 트레이더들이 기능을 검토하고 검증할 수 있도록 했습니다. 작성자에게 찬사를 보냅니다! 이 코드는 무료로 사용할 수 있지만, 코드를 재게시하는 경우 하우스 룰이 적용된다는 점을 기억하세요.
면책사항
해당 정보와 게시물은 금융, 투자, 트레이딩 또는 기타 유형의 조언이나 권장 사항으로 간주되지 않으며, 트레이딩뷰에서 제공하거나 보증하는 것이 아닙니다. 자세한 내용은 이용 약관을 참조하세요.