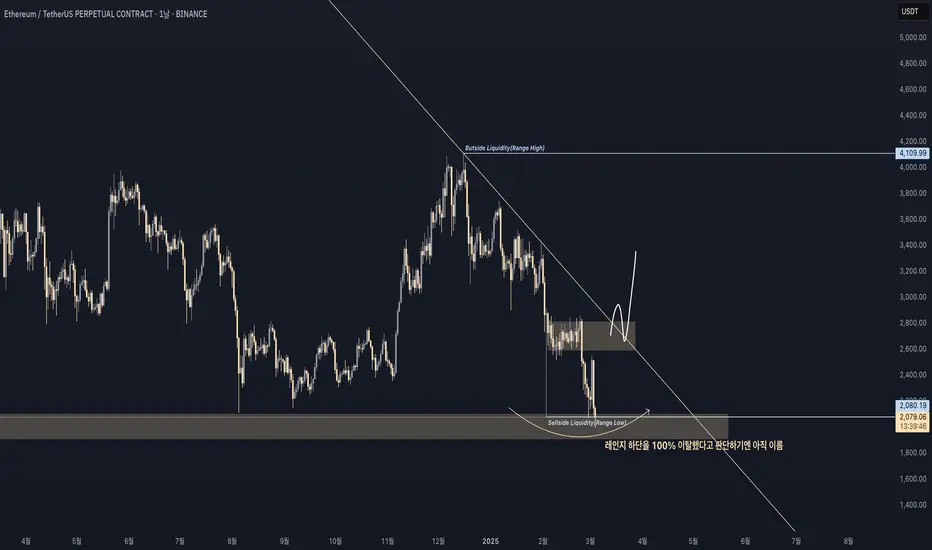
ETHUSDT는 어떻게 봐야 맞을까요? 세력들이 유동성 제거를 하는 이유와 그 목적에 대해 적어보았습니다. 이더리움은 이번 하락에서 가장 많이 거론이 되던 종목입니다.
↪하락을 보여줄 때마다 하락폭이 강하고, 빠르게 생성되었고, 지속적은 저점 갱신으로 매수 위주의 개인투자자들에게 크게 신뢰를 잃었다고 해도 과언이 아니라고 생각합니다.
이더리움 일봉 차트입니다.
전체적인 구조 및 레인지는 위와 같이 두 개의 매물대를 이용한 키레벨과 하나의 레인지를 구성했습니다.
저는 지난 2월 초에 나왔던 하락에서 생성된 저점이 지지받았던 구간과, 이번에 해당 저점을 갱신했을 때 저항받았던 구간을 현재 가장 중요한 레벨로 판단하고 기준을 잡고 있습니다.
✔ 저점이 갱신되었는데도 레인지를 위와 같이 설정한 이유는 아직 해당 레인지 하단을 100%이탈했다고 확정짓기가 어렵기 때문입니다.
✔ 위 차트와 같이 레인지 하단을 몸통으로 마감해준 모습을 보지 못했고, 하단 키레벨에서 지속적으로 지지 받는 모습을 보여주기 때문에 레인지 하단을 몸통으로 마감해주면서,키레벨에서 더 이상 지지받는 모습이 나오지 않는다면 해당 구간에서의 레인지 하단 sweep을 통한 유동성 제거는 실패되었다. 라고 말씀드릴 수 있을 것 같습니다.
보통 레인지 스윕은 고점과 저점이 뚜렷한 레인지가 존재하고, 해당 레인지를 돌파(이탈)했다가 캔들의 꼬리를 남겨 마감했을 때를 이야기합니다.
Range Sweep, Stop Hunt, Fake Out등... 여러가지 다른 이름으로도 불리우는 이런 무빙은 뚜렷한 목적을 가지고 있습니다.
흔히 마켓을 주도하는 세력(해외에서는 이를 Smart Money 라고 부릅니다.)들의 주 목적은 개인 투자자들과 반대로 가는 움직임을 보여주면서 개인 투자자들의 포지션(유동성)을 최대한 많이 없애고 나오는 급격한 가격 반전 움직임입니다.
또한 일반적인 개인 투자자들의 매매 방식은 가격이 내려가는 모습을 보여주면 추격으로 매수 or 매도를 하면서 가격을 따라가는 매매를 통해 스탑로스를 해당 무빙이 나오게 된 파동의 고점 or 저점으로 설정해두는 등으로 단순한 매매 방식을 보여줍니다.
스마트 머니는 이를 노려 개인 투자자들의 스탑로스 물량 즉, 차트의 유동성을 없애 가격 반전을 일으킵니다.
●BSL (Buy-Side Liquidity): 고점 위에 위치한 매도 포지션들의 스탑로스 유동성. 가격이 이를 터치하면 반
전 가능성 있음.
●SSL (Sell-Side Liquidity): 저점 아래에 위치한 매수 포지션들의 스탑로스 유동성. 가격이 이를 터치하면 반
전 가능성 있음.
Liquidity Sweep(유동성 제거)은 보통 위와 같은 목적, 방식으로 출현하게 됩니다.
눈에 익혀두시면 분명 많은 도움이 되실 겁니다.
중간에 유동성 제거에 대한 설명으로 말이 길어졌습니다.
결국 저는 이더리움이 일봉상 하단에서 일어나고 있는 움직임을 아직까지 유동성을 제거하고 있는 과정으로 판단하고 있으며, 상단 추세라인과 저항을 받았던 곳에서 생성된 레인지 내부 매물대 키레벨을 돌파했을 시(추세 변경) 레인지 상단인 4100불까지 상승을 노려볼 수 있을 것으로 보여집니다.
▩이번 관점에서 중요한 점은 유동성 제거의 방식과 목적입니다.
유동성 제거 이후 나오는 무빙을 매매하기 위해 알고 있어야되는 중요한 점은 유동성 제거가 일어나고 있는 시점에서 포지션을 잡는 것이 아닙니다. Higher Time Frame에서 유동성 제거가 나오게 된다면 Middle, Lower 순서로 탑다운 분석을 통해 반전 되는 가격 움직을 챙긴다는 것입니다.
아마도 다음 분석에서는 유동성 제거가 나온 뒤 반전되는 가격 움직임을 올바르게 따라갈 수 있는 방법에 대해 말씀드릴 수 있을 것 같습니다.
감사합니다.
아이디어에서 "Smart"에 대해 찾기
데이터: SmartMoney 주소는 어제 약 2300억 개의 PEPE를 재매입했고, 오늘 39.8억 개의 RFD를 Lookonchain 데이터에 따르면 Smart Money 주소는 15시간 전에 200ETH를 약 2300억 개의 PEPE로 다시 환전했으며 오늘 2시간 전에 165ETH를 약 39억 8000만 개의 RFD로 환전했습니다.루콘체인에 따르면 이 주소는 2일 이내에 거래 RDF를 통해 102ETH의 이익을 얻었다.

익명의 ETH Smart Trader 주소는 3시간 전에 3000개의 ETH를 Binance로 이체합니다Spot On Chain 데이터에 따르면 한 익명 ETH Smart Trader 주소는 3시간 전에 3,000개의 ETH를 Binance로 전송했으며 가치는 약 587만 달러에 달했습니다.이 주소는 지금까지 바이낸스에서 ETH를 거래해 449만 달러(투자수익률 46.07%)를 벌어들인 것으로 알려졌습니다.

바이낸스, 멀티체인 크로스체인 토큰 충전 및 현금 인출 일시 중단 발표7월 5일 공식 공지에 따르면 바이낸스는 BNB Smart Chain을 통한 Polkastarter(POLS), BNB Smart Chain을 통한 Alchemy Pay(ACH), 팬텀 네트워크를 통한 Beefy.Finance(BIFI), BNB Smart Chain을 통한 SuperVeters(ACH), Fantom Network를 통한 Beefy.Finance(BI)의 충전 및 현금 인출 업무를 7월 7일 08:00부터 중단한다고 합니다.通过BNB Smart Chain的Harvest Finance(FARM)。
바이낸스는 멀티체인(MULTI) 협정의 최근 상황으로 인해 바이낸스가 2023년 05월 24일 여러 멀티체인 크로스체인 토큰의 충전 업무를 중단했다고 언급했다.

ETH/USDT - 4H POI Reached, LTF Sweep & Choch4H 타임프레임에서 수요구간(POI)까지 가격이 리테스트 한 상황.
HTF에서 가격이 구조적 Discount 영역에 안착한 상태에서,
LTF(15m ~ 1m)에서 유동성 스윕 → CHOCH → OB 리테스트(대기) 순서가 매끄럽게 완성되었다.
1. HTF 구조 (4H POI 반응)
가격은 4H 기준의 핵심 수요 존에 도달한 뒤 첫 반등을 시도한 상태.
직전 하락 파동의 저점들을 테스트하며 HTF Discount Zone에 진입.
HTF는 아직 완전한 추세 전환은 아니지만, 반등 여력을 확보한 구조적 매수 압력이 존재.
2. LTF 구조 전환 (Liquidity Sweep + CHOCH)
LTF에서는 아래 순서가 나타남:
Low Sweep
– 이전 저점을 살짝 깨고 회수 → 저점 유동성 제거
CHOCH(구조전환) 발생
– 하락 구조가 처음으로 무너진 지점
Order Block(수요 OB) 형성
– 스윕 이후 상승을 만든 마지막 매수 캔들 확인
리테스트 진입 구간 도달시 매수
– 가격이 해당 OB로 회귀하며 재반응 시 매수 셋업 유효
이 구조는 HTF 수요 존과 동기화되어 있어 신뢰도 높은 매수 구조적 조건이 충족된 상태

체인링크(LINK), ‘데이터×결제×토큰화’ 3축이 동시에 잠금해제…다음 랠리는 ‘기관 파이프라인’이 견인한다🔥 “체인링크(LINK), ‘데이터×결제×토큰화’ 3축이 동시에 잠금해제…다음 랠리는 ‘기관 파이프라인’이 견인한다” 🔥
지금 LINK는 그냥 알트코인 섹터 베타가 아니야. ICE 실시간 시세, DTCC 펀드 NAV, SWIFT 결제 브릿지까지—전통 금융의 핵심 배관이 한 줄로 이어지고 있어. 이건 유동성 ‘유입 경로’가 명확해진다는 뜻이고, 네트워크 수요가 LINK 토크노믹스로 귀결되는 구조가 깔렸다는 뜻이지. (이어서 계속👇)
1️⃣ 📊 가격·규모 스냅샷: $21대 / 시총 약 $145억 / 유통량 ≈ 6.78억 개 — 숫자 자체보다 ‘기관 파이프’ 연결이 시작됐다는 점이 더 큼. (CMC 실시간·히스토리 기준)
2️⃣ 🌍 ICE(뉴욕증권거래소 모회사) 데이터 온체인화 — ICE Consolidated Feed의 FX·귀금속 시세가 Chainlink Data Streams 파생 레이트 산출에 투입, 온체인 앱이 ‘은행급’ 데이터를 저지연으로 호출 가능.
3️⃣ ⚡ Data Streams = 저지연·풀(Pull)형 오라클 — 고빈도 데이터를 오프체인에서 집계하고 온체인에서 검증, 프런트러닝 억제·업데이트 지연 축소. 파생/옵션/퍼프 프로토콜에 최적.
4️⃣ 🏦 DTCC ‘Smart NAV’ 파일럿 완주 — JPM·BNY·프랭클린 템플턴 등이 참여, 펀드 NAV 멀티체인 배포를 실증. 펀드 ‘구독·환매’ 자동화까지 시야가 열림.
5️⃣ 💳 SWIFT–UBS AM–Chainlink 결제 브릿지 — MAS 프로젝트 가디언 맥락에서 토큰화 펀드의 오프체인 현금결제 연계를 공식 시연(2024-11-05). “기존 SWIFT 인프라로 토큰화 자산 결제 연결 가능”이 포인트.
6️⃣ 🧱 Chainlink Reserve 가동(2025-08-07) — 온·오프체인 서비스 수익을 자동으로 LINK 전환·축적 하는 ‘전략적 준비금’ 메커니즘 도입 → 구조적 순매수 압력. 전용 페이지 공개.
7️⃣ 🛡 스테이킹 v0.2(확장형 풀) — 참여·보안 유인을 강화, 대규모 언스테이킹 없이 네트워크 인센티브 구조를 안정화(초기 4,500만 LINK 풀에서 확장). (공식 개요 기준)
8️⃣ 📉 거래소 내 LINK 재고 하락 트렌드 — 2024 ~2025 동안 거래소 보유량 저점 갱신 이슈가 반복 공유됨(장기 매도압 축소 신호로 해석 가능). (온체인 애널리틱스 인용 보수적 해석 권장)
9️⃣ 🔗 CCIP(크로스체인 인터옵) — 퍼블릭/프라이빗 모두 연결, 메시지·토큰 이동을 보안 DON으로 처리 → 기관 프라이빗체인 × 퍼블릭체인 교차 업무가 실무화되는 길.
🔟 🧮 Data Streams 실전 채택 시그널 — 저지연·커밋-리빌(프런트런 방어) 설계를 프로토콜 제안서들이 채택하며 검토(예: Synthetix V3 SIP-398).
1️⃣1️⃣ 🧰 Products 풀스택 — CCIP(상호운용), Data Streams(저지연 시세), VRF(검증가능 난수), Proof of Reserve(준비금 검증), Functions/Automation(웹2 API·주기 실행)로 엔터프라이즈-온체인 브릿지 완성형.
1️⃣2️⃣ 🧾 RWA·펀드 토큰화 TAM — 2030년 토큰화 자산 $4 ~5조 (Citi) to $16조 (BCG/ADDX)까지 전망 분포. 상단 가정이 모두 이뤄지지 않더라도 ‘저점 시나리오’만으로도 대형 시장.
1️⃣3️⃣ 🧮 거래·결제 스택 비용 절감 — BCG·DTCC 자료: DLT 도입 시 결제주기 단축·담보 관리 효율화로 연 $100B+ 자원 해방 추산, 인프라 비용 절감 $150 ~200억 규모 기대.
1️⃣4️⃣ 🛠 전통 금융 ‘연결성’의 핵심 부품 — 시세(ICE), 펀드데이터(DTCC), 결제(SWIFT) 각각의 ‘관문’에서 체인링크가 실사용 파일럿을 통과 → 파일럿→한정 롤아웃→상용화 루프 기대.
1️⃣5️⃣ 🧭 규제·감사 친화: Proof of Reserve — 스테이블·브릿지·RWA 준비금 검증 표준을 선점, 전통기관의 컴플라이언스 체크리스트를 체인링크로 채우는 흐름.
1️⃣6️⃣ ⚖️ 거시 리스크는 상수 — CPI·금리·DXY 변화에 암호자산 전반 변동성 ↑. 특히 현물 유동성 얇을 땐 이벤트 드리븐 스파이크 후 반납 가능성 유의.
1️⃣7️⃣ 🧪 파일럿→프로덕션 전이 관찰법 — (a) ICE 레이트를 실제 채택하는 파생/옵션 프로토콜 수, (b) Smart NAV의 정규 서비스화 발표, (c) Reserve 잔액·유입 소스 투명성 업데이트.
1️⃣8️⃣ 🧮 가격 레벨링 로직 — $16 ~17 지지 유지 + $22 ~25 박스 상단 안착 시 단기 고점 갱신 가능성. 데이터 스택 뉴스플로우가 견인하면 ‘뉴스-가격’ 피드백 루프 형성.
1️⃣9️⃣ 🧠 ‘오픈 데이터’에서 ‘프리미엄 데이터’로 — 단순 공짜 피드 시대에서, 검증가능·저지연·책임소재 있는 시세 로 업그레이드. 데이터에 금리가 붙는 구간.
2️⃣0️⃣ 🔌 웹2 API-온체인 자동화 — 결제지시·정산·리밸런싱 같은 백오피스 업무를 Functions/Automation으로 이전하면, 운영비 절감→온체인 활용 증가→LINK 수요 전이.
2️⃣1️⃣ 🧭 SWIFT의 로드맵 자체가 촉진제 — SWIFT가 2025년 라이브 트랜잭션 시험을 예고, 전통 결제망의 ‘토큰화/디지털통화’ 실전 단계 진입은 CCIP·Data Streams 수요를 자극.
# 내가 보는 결론(핵심 정리)
서사 : “알트 랠리”가 아니라 전통금융 파이프의 상용화 시나리오. ICE(데이터) × DTCC(NAV데이터) × SWIFT(결제)가 한 줄로 묶이면, DeFi가 아니라 Onchain Finance 의 메인스트림이 열린다.
토크노믹스 : Chainlink Reserve 로 서비스 수익→LINK 자동 전환(순매수), 스테이킹 v0.2 로 네트워크 보안·참여 인센티브 안정화, 거래소 재고 하락 은 구조적 매도압 완화.
TAM : 2030년 $4 ~5조(Citi)↔ $16조(BCG) 분포—상단 가정이 다 안 나와도 시장은 충분히 큼. 체인링크는 그 표준화된 데이터·결제·상호운용 레이어 에 가장 먼저 앉아 있다.

나스닥의 진실 - 너의 포지션은 언젠간 죽게되어있다.CME_MINI:NQH2025
안녕하세요 트레이딩뷰 가족 여러분,
저번 글에 이어 이번에는 ICT의 관점으로 나스닥 선물에 대해 논해보겠습니다.
한국에서 ICT의 매매전략은 상당히 생소한 편입니다.
제가 찾아본 한국어 자료도 일부 있지만, 아무래도 영어를 기반으로 한 개념이다보니 한국으로의 도입이 쉽지는 않은 것 같습니다.
오늘 글에서는 ICT는 이런 생각으로 매매에 임하는구나 정도로 생각하시면 좋겠습니다.
아마 오늘 우리는 조금 불편한 진실에 마주할 수도 있습니다.
1. 선물 시장은 제로섬 게임이다. 내가 돈을 벌면 남은 잃는다.
-> 내가 잃어야 그들(세력)이 돈을 번다.
-> 그렇다면, 그들은 나(내 포지션)를 죽이기 위해 돈을 쓴다.
2. 사람들의 손절가는 어느정도 정해져 있다.
-> 고점 조금 위에, 저점 조금 아래에서 손절을 걸어둔다.
-> 그곳만 터트리면 개미는 죽는다.
이 두 가지 주장에 대해서 여러분들은 어떻게 생각하시나요.
저는 저 두 가지 원리를 바탕으로 시장을 바라보는게 합리적이라고 생각합니다.
우리가 두 가지 주장을 받아들일 수 있다면 작은 소결론에 도달하게 됩니다.
시장은 개미들의 손절을 터트리고 의도한 방향으로 나아간다.
납득이 되시나요 ?
위에서 말한 것이 바로 "Liquidity"입니다. 한국어로는 유동성이라고 합니다.
흔히 국장에서는 LP(Liquidity Provider)로 이 단어를 들어보신 분이 계실겁니다.
더 쉽게 설명하자면 Liquidity, 즉 유동성은 개미들의 손절 주문이라고 생각하시면 됩니다.
그렇다면 그 개미들의 주문을 죽이는 것을 무엇이라고 할까요.
"Liquidity Sweep"이라고 합니다. 흔히들 휩쏘라고 알고계시는 상황입니다.
오늘은 나스닥 차트에 불균형과 주요 유동성을 몇 개 체크해 놓았습니다.
시장이 뷸균형을 맞추려고 한다. 시장이 개미들을 죽이려고 한다.
그 말인 즉, 제가 표시해 놓은 영역들은 일종의 자석처럼 행동한다는 것입니다.
차트의 자석들은 가격을 끌어들이는 역할을 합니다.
그 불균형의 범위가 클수록, 더 큰 시간 프레임에서 만들어질 수록 더 강한 자석이 됩니다.
또한, 유동성이란 어렵지 않습니다.
일반적으로 지지, 저항이란 개념을 먼저 배웁니다. 사람들은 저점을 깨지 않을 것이야. 생각을 하고 포지션을 잡습니다.
당연히 손절 주문은 내가 생각한 지지점 바로 아래에 있겠죠.
세력들은 이 심리를 역이용 합니다. 우리가 합의했다시피.
이 유동성 또한 가격을 잡아 당기는 역할을 합니다.
아직 25년의 2월입니다. 제가 생각하기론 상승이든 하락이든 아직 그렇다 할만한 Liquidity Sweep은 나오지 않았습니다.
매수나 매도에 진입하는 것에 조금 더 신중을 기하고 기다릴 때입니다.
제가 표시 해 놓은 영역에서 어떤 반응을 보이는지 지켜보며 3월 4월을 기다리는 것이 좋아보입니다.
역사적으로 미장은 2 3 4월에 수익률이 좋지 못합니다. 왜 그럴까요?
연초에 아직 개미들의 포지션이 충분히 쌓이지 않아서라고 생각합니다. 3 4월 쯤에 이 개미를 죽이는 Liquidity Sweep이 일어나니 당연히 매수 심리가 강한 개미들의 수익률이 좋지 못할 수 밖에요.
이해가 안되는 부분이 있다면 질문해 주시면 친절히 답변드리겠습니다.
또 뵙겠습니다 ! 좋은 하루 되세요 !
*저는 개인적으로는 숏 위주로 매매하고 있습니다. 롱 좀 죽이고 올라갈 것 같네요.
*다음에는 제 나스닥 데이트레이딩 전략을 소개해보도록 하겠습니다.
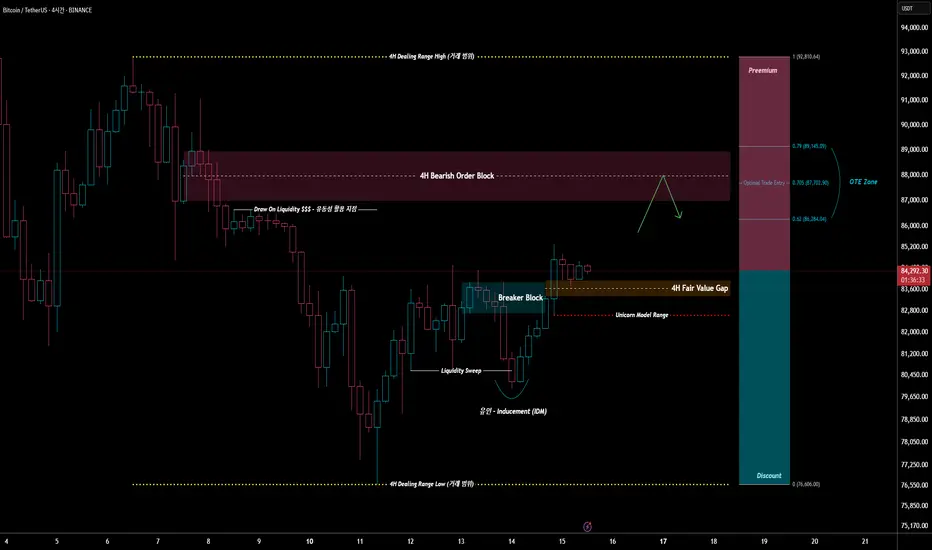
Unicorn Model 출현84.5K의 고점을 돌파하는 과정에서
강세 브레이커 블럭과 불균형캔들(IMB)이 출현 했고,
현재 4H FVG의 중간값(50%/CE)에서 가격 반응이 나오고 있는 상황입니다.
자세히 보면 브레이커블럭 영역과 FVG 영역이 겹치는 형태임을 알 수 있습니다.
이런 형태를 Unicorn Model이라고 합니다.
유니콘 모델은 통계적으로 약 80% 정도의 승률을 자랑하는데요.
즉, 현재 유니콘 모델의 진입 영역 안에서 가격 반응이 나오고 있으며,
유니콘 모델의 무효화 지점은 약 82.6K 부근입니다.
해당 모델이 무효화되지 않는다면, 계속해서 상승을 이어나갈 것으로 보입니다.
즉, 82.6K가 상승 지속에 대한 기준이 될 수 있으며
작은 타임프레임에서 매수 기회를 노려볼 수 있겠습니다.
미국주식 CENN 매수관점
매수하기 좋아보여 평소엔 거래하지 않는 미국주식 종목을 포트폴리오에 추가해보았다.
매수시점 5/2
평단가 1.41
1차목표가 1.98 (40%)
2차목표가 2.18 (54%)

2026년 1월 19일 주간 비트코인(BTC) 심층 시장 분석1. 개요 및 주요 요약 (Executive Summary)
2026년 1월 18일 현재, 비트코인(BTC)은 $95,000 - $96,000 구간에서 거래되며, 2025년의 조정 국면을 뒤로하고 2026년 초입부터 강력한 회복세를 보이고 있다. 본 보고서는 향후 1주일(2026년 1월 19일 주간) 및 향후 1개월간의 가격 동향을 예측하기 위해 기술적 지표, 온체인 데이터, 그리고 거시경제적 변수들을 종합적으로 분석하였다.
현재 시장은 **'유동성 주도 반등(Liquidity-Driven Rally)'**과 '장기 추세 저항(Secular Resistance)' 간의 치열한 공방전이 벌어지고 있는 형국이다. 1월 초부터 재개된 미국 현물 비트코인 ETF로의 대규모 자금 유입(주간 약 17억 달러)은 시장의 하단을 강력하게 지지하고 있으나, 기술적으로는 여전히 200일 이동평균선($105,818) 아래에 위치하여 장기적인 강세장 확정을 위해서는 추가적인 모멘텀이 필요한 상황이다.
이번 주(1월 19일 주간)는 다보스 포럼(WEF)에서의 지정학적 리스크 및 도널드 트럼프 미국 대통령의 연설, 그리고 미국 연방정부 셧다운 이후 지연되었던 10~11월 개인소비지출(PCE) 물가 지표 발표가 예정되어 있어 변동성이 극대화될 것으로 예상된다. 본 분석은 현재의 상승 모멘텀이 유지될 경우 단기적으로 $100,000 돌파 시도가 있을 것으로 전망하나, 거시경제 지표의 충격 여부에 따라 $90,000 초반으로의 일시적 후퇴 가능성도 배제하지 않는다.
핵심 전망 요약:
시장 성격: 기관 주도의 저가 매수세(Dip Buying)와 채굴자들의 매도 압력이 충돌하는 구간.
기술적 위치: 단기 상승 추세(50일 이평선 상회) vs 장기 하락 추세(200일 이평선 하회)의 샌드위치 국면.
핵심 변수: ETF 순유입 지속성, 다보스 포럼의 규제 관련 발언, 지연된 PCE 데이터의 인플레이션 수치.
기본 시나리오 (확률 60%): $96,000 저항선 돌파 후 $99,500~$102,000 구간 테스트.
2. 거시경제 환경 분석 (Macroeconomic Landscape)
비트코인의 가격 결정 메커니즘은 더 이상 독립적인 암호화폐 시장 내부의 논리로만 설명될 수 없다. 2026년 현재 비트코인은 글로벌 유동성 환경에 민감하게 반응하는 '매크로 자산'으로 편입되었으며, 따라서 미 연준(Fed)의 정책과 인플레이션 지표, 그리고 지정학적 이벤트는 가격 변동의 가장 큰 트리거(Trigger)로 작용한다.
2.1 미 연준(Fed) 통화 정책 및 금리 전망
2025년 12월, 미 연준은 기준금리를 25bp 인하하여 3.50%~3.75% 구간으로 조정하였다. 이는 시장에 유동성을 공급하는 긍정적인 신호였으나, 2026년의 금리 인하 경로에 대해서는 시장과 연준 간의 시각차가 존재한다.
Fed의 입장 (점도표): 연준 위원들의 점도표(Dot Plot) 중앙값은 2026년 중 단 한 차례의 25bp 금리 인하만을 시사하고 있다. 이는 인플레이션이 완전히 목표치(2%)에 도달하지 않았다는 보수적인 판단에 기인한다.
시장의 기대: 반면, 시장 참여자들과 일부 금융기관(UBS 등)은 2026년 1분기에 추가적인 25bp 인하를 기대하고 있으며, 경제 둔화 우려에 따라 연내 2~3회 인하 가능성까지 가격에 반영하고 있다.
비트코인에 미치는 영향: 현재 미 국채 시장의 변동성을 나타내는 MOVE 지수가 4년래 최저치인 58 수준으로 하락했다. 채권 시장의 안정은 위험 자산 선호 심리(Risk-On)를 자극하며, 이는 비트코인이 $95,000선을 회복하는 데 결정적인 배경이 되었다. 만약 1월 FOMC 회의(1월 27-28일)를 앞두고 금리 동결 또는 매파적 발언이 나온다면, 현재의 상승세는 단기적인 제동이 걸릴 수 있다.
2.2 인플레이션 지표와 지연된 PCE 데이터 리스크
이번 주 시장의 가장 큰 불확실성 요인은 1월 22일(목)로 예정된 미국 경제분석국(BEA)의 개인소비지출(PCE) 물가 지수 발표이다.
데이터의 특수성: 이번 발표는 지난 연말 정부 셧다운으로 인해 지연되었던 2025년 10월과 11월 데이터가 한꺼번에 공개되는 일정이다.
시장 예상치: 11월 소비자지출은 0.5% 증가, 개인소득은 0.4% 증가가 예상되며, 헤드라인 및 근원 PCE 물가는 전월 대비 0.2% 상승할 것으로 전망된다.
시나리오별 파급 효과:
예상치 부합 또는 하회: 인플레이션 둔화 추세가 확인되며 비트코인에는 강력한 상승 재료로 작용할 것이다. 이는 연준의 금리 인하 명분을 강화시킨다.
예상치 상회 (서프라이즈): 만약 지난 데이터가 예상보다 높게 나온다면, 시장은 "연준이 12월에 성급하게 금리를 내렸다"는 공포감에 휩싸일 수 있다. 이는 달러 인덱스(DXY)의 급등과 비트코인의 급락($92,000 이탈)을 유발할 수 있는 잠재적 악재다. 최근 CPI(소비자물가지수)가 2.7%로 안정적인 흐름을 보였기에 확률은 낮지만, 셧다운 기간의 데이터 공백은 변동성을 키우는 요인이다.
2.3 다보스 포럼 2026과 지정학적 모멘텀
1월 19일부터 스위스 다보스에서 열리는 세계경제포럼(WEF)은 비트코인 시장에 뜻밖의 규제 모멘텀을 제공할 것으로 보인다. 특히 도널드 트럼프 미국 대통령이 1월 21일(수) 특별 연설을 할 예정이다.
트럼프의 아젠다: 트럼프 행정부는 "역사상 가장 큰 규제 완화"를 천명하고 있으며, 미국을 "암호화폐와 인공지능의 세계 수도"로 만들겠다는 비전을 제시할 것으로 예상된다.
규제 명확성: 공화당이 주도하는 새로운 암호화폐 규제 법안이 2026년 2월 말까지 통과될 가능성이 논의되고 있다. 다보스에서 나올 친(親)크립토 발언들은 기관 투자자들에게 규제 리스크 해소라는 강력한 매수 신호를 줄 수 있다. 이는 현재 진행 중인 기관 자금 유입을 가속화하는 촉매제가 될 것이다.
3. 온체인 데이터 및 시장 구조 분석 (On-Chain & Market Structure)
가격 차트가 시장의 '결과'라면, 온체인 데이터는 시장의 '원인'을 보여준다. 현재 비트코인 시장은 개인 투자자(Retail)보다는 거대 자본(Institutional Smart Money)에 의해 움직이고 있음이 데이터로 확인된다.
3.1 현물 ETF 유동성 분석: "기관의 귀환"
2026년 1월 초, 비트코인 시장의 가장 큰 동력은 단연 미국 현물 ETF로의 자금 재유입이다. 2025년 말 세금 목적의 매도(Tax-loss harvesting)로 인한 유출세가 진정되자마자, 기록적인 규모의 매수세가 유입되고 있다.
기간 순유입 규모 (BTC) 추정 금액 (USD) 주요 특징
1월 2주차 (1/6~1/12) +17,700 BTC ~$16.8억
2025년 10월 이후 최대 주간 유입
1월 13일~15일 N/A ~$17억+
3일 만에 폭발적 유입 가속화
주도 기관 BlackRock (IBIT) 일일 $6.48억
압도적인 시장 점유율 1위
추격 기관 Fidelity (FBTC) 일일 $1.25억
꾸준한 자금 집행
분석 인사이트:
V자형 회복: 12월 말의 유출이 구조적인 이탈이 아니라 일시적인 장부 정리였음이 증명되었다. 기관들은 $90,000 초반 가격대를 매력적인 진입 구간으로 인식하고 있다.
공급 충격(Supply Shock): ETF들이 주간 17,700 BTC를 매집하는 동안, 채굴자들이 생산하는 비트코인은 약 3,150 BTC(일일 450 BTC * 7일)에 불과하다. 즉, 생산량 대비 수요가 5.6배에 달하고 있다. 이러한 수급 불균형은 가격 상승 압력으로 직결된다.
3.2 거래소 공급량 (Exchange Reserves) 변화
중앙화 거래소(CEX) 내 비트코인 잔고는 지속적으로 감소하는 추세를 보이고 있다.
의미: 거래소 잔고 감소는 투자자들이 비트코인을 매도하기 위해 거래소에 두는 대신, 콜드 월렛이나 수탁(Custody) 서비스로 이동시키고 있음을 의미한다. 이는 매도 가능한 유동성(Sell-side Liquidity)의 고갈을 야기하며, 작은 매수 주문에도 가격이 크게 튈 수 있는(Slippage) 환경을 조성한다.
파생상품 시장의 영향: 현물 주도의 상승장이지만, 최근 $94,000~$97,000 구간 돌파 시 약 7억 달러 규모의 숏 포지션 청산(Short Squeeze)이 발생하며 상승폭을 키웠다. 이는 선물 시장의 투기적 포지션보다 현물 매집이 가격을 주도하고 있음을 시사한다.
3.3 채굴자 동향: 해시레이트와 항복(Capitulation) 리스크
상승장의 잠재적 걸림돌은 채굴자(Miner)들의 상황이다.
난이도 최고치 경신: 비트코인 채굴 난이도는 2026년 1월 현재 **148.2조(T)**를 기록하며 역대 최고치를 경신했다. 이는 채굴 비용의 급격한 상승을 의미한다.
채굴자 항복(Miner Capitulation): 에너지 비용 상승과 반감기(2024년) 이후의 보상 감소 여파로, 재무 구조가 취약한 중소형 채굴자들은 보유한 비트코인을 매도하여 운영비를 충당해야 하는 상황에 몰려 있다.
위협 요인: 채굴자들이 $96,000 부근의 반등을 매도 기회로 활용할 가능성이 존재한다. 그러나 현재 ETF의 매수 강도가 채굴자들의 매도 물량을 충분히 소화하고 있어, 가격 하락보다는 상승 탄력을 둔화시키는 요인 정도로 작용할 전망이다.
4. 기술적 분석 (Technical Analysis)
전문 분석가 관점에서 현재 비트코인 차트는 **"장기 하락 추세 속의 강력한 단기 반등"**이라는 복합적인 신호를 보내고 있다. 단순히 '오른다/내린다'가 아닌, 주요 지표들이 가리키는 구조적 변곡점을 이해해야 한다.
4.1 추세 분석: 이동평균선의 딜레마 (50MA vs 200MA)
현재 비트코인 가격($95,500 부근)은 두 개의 핵심 이동평균선 사이에 갇혀 있다. 이 구간은 트레이더들에게 '전장(Battleground)'으로 불린다.
50일 단순이동평균선 (SMA): 약 $90,321
상태: 가격이 50일선 위에 위치하며, 기울기가 완만하게 상승 전환을 시도하고 있다.
의미: 단기~중기 추세는 **매수 우위(Bullish)**로 전환되었다. $90,000 초반은 이제 강력한 기술적 지지선(Support Floor)으로 작용한다. 조정 시 이 구간에서의 반등 확률이 매우 높다.
200일 단순이동평균선 (SMA): 약 $105,818
상태: 가격이 200일선 아래에 위치하고 있다. 이는 전통적인 기술적 분석상 여전히 장기 약세장(Bear Market) 또는 조정장의 영역에 있음을 시사한다.
의미: $105,000 부근은 철옹성 같은 저항선이다. 이 선을 뚫어내지 못한다면 현재의 상승은 '데드캣 바운스(Dead Cat Bounce)'나 '베어마켓 랠리'로 끝날 수 있다.
데드크로스/골든크로스 징후: 현재 50일선이 200일선 아래에 위치한 상태(데드크로스 이후)이지만, 가격 상승으로 50일선이 고개를 들고 있다. 향후 1~2개월 내 가격이 $100,000을 유지한다면, 50일선이 200일선을 상향 돌파하는 **'골든크로스(Golden Cross)'**가 발생할 가능성이 열려 있다. 이는 장기 상승장의 확정 신호가 될 것이다.
4.2 모멘텀 지표 분석 (RSI & MACD)
상대강도지수 (RSI): 현재 62.21
해석: 통상적으로 RSI 70 이상을 과매수(Overbought), 30 이하를 과매도(Oversold)로 본다. 현재 62라는 수치는 **'건전한 상승세'**를 의미한다. 매수세가 강하지만 아직 과열 단계는 아니므로, 가격이 추가 상승할 여력(Room to Run)이 충분히 남아있다는 뜻이다.
MACD (이동평균 수렴확산지수):
상태: 히스토그램이 0선 부근에서 플랫(Flat)하거나 약한 양수를 보이고 있다.
해석: 상승 모멘텀이 존재하나 폭발적이지는 않다. MACD 시그널 선의 골든크로스가 임박했거나 막 발생한 상태라면, 이는 추세 추종(Trend Following) 전략에 있어 매수 신호로 해석된다.
4.3 변동성 지표 (볼린저 밴드)
볼린저 밴드는 현재 수축(Squeeze) 후 확장을 준비하는 단계이다.
상단 밴드 (저항): $97,546
하단 밴드 (지지): $86,905
전략: 가격이 상단 밴드($97,546)를 강하게 돌파하며 밴드가 위쪽으로 벌어질 경우(Band Walk), 이는 강력한 변동성 확장을 동반한 급등 신호가 된다. 반대로 상단 밴드 터치 후 음봉이 발생하면 박스권 상단 저항으로 인식하고 매도해야 한다.
4.4 지지 및 저항 레벨 (Pivot Points)
1차 저항: $96,000 (전고점 및 심리적 저항)
2차 저항 (강력): $97,500 ~ $98,000 (볼린저 밴드 상단 및 주봉상 주요 매물대)
최종 저항: $105,800 (200일 이동평균선)
1차 지지: $94,473 (단기 생명선, 이탈 시 주의)
2차 지지: $92,200 (20일 이동평균선)
3차 지지 (최후): $90,300 (50일 이동평균선)
5. 시나리오별 전망 및 대응 전략 (Scenario Planning)
위의 분석을 바탕으로 향후 1주일 및 1개월간 발생 가능한 시나리오를 세 가지로 도출하였다.
시나리오 A: 강세 돌파형 (Bullish Breakout) - 확률 60%
전제 조건: ETF 순유입이 일평균 3억 달러 이상 지속되고, PCE 지표가 시장 예상치(0.2%)에 부합하며, 트럼프의 다보스 연설이 친암호화폐적일 경우.
가격 경로:
주초 $96,000 저항선을 거래량을 동반하여 돌파.
$97,500(볼린저 상단)에서 짧은 숨고르기 후 $100,000 심리적 저항선 테스트.
1개월 내 $105,800(200일선) 터치 시도.
대응 전략:
매수(Long): 현재가($95,500) 또는 $96,000 돌파 확인 시 진입.
목표가(Take-Profit): 1차 $99,500, 2차 $105,000.
손절가(Stop-Loss): $93,800 (주요 지지선 이탈 시).
시나리오 B: 박스권 횡보 및 조정 (Neutral/Correction) - 확률 30%
전제 조건: PCE 지표가 예상보다 높게 나와 인플레이션 우려가 재점화되거나, 다보스 포럼에서의 발언이 원론적인 수준에 그칠 경우. 채굴자 매도 물량 출회.
가격 경로:
$96,000~$97,500 구간 돌파 실패.
$94,473 지지선을 하향 이탈하며 실망 매물 출회.
$90,300(50일선) 부근까지 하락하여 지지력 테스트 후 재반등 모색.
대응 전략:
관망/매수 대기: 추격 매수를 자제하고 $90,500~$92,000 구간에서 분할 매수(DCA) 접근.
목표가: 반등 시 $95,000.
손절가: $89,500 (50일선 붕괴 시 즉각 손절).
시나리오 C: 약세 전환 (Bearish Reversal) - 확률 10%
전제 조건: 지정학적 위기 발생(전쟁 확전 등) 또는 미 정부의 예상치 못한 강력한 규제 발표. ETF 자금 유출 전환.
가격 경로:
$90,000 지지선 붕괴.
패닉 셀(Panic Sell) 발생으로 볼린저 밴드 하단($86,900) 이하로 추락.
대응 전략:
모든 롱 포지션 청산 및 숏(Short) 포지션 헤징 고려. 현금 비중 확대.
6. 결론 및 투자자 제언
2026년 1월 19일 주간은 비트코인이 **'진정한 강세장으로의 복귀'**를 타진하는 중요한 분수령이 될 것이다.
전문 분석가 총평:
"현재 비트코인은 기술적 저항(200일선)과 펀더멘털 개선(ETF 유입, 규제 완화 기대) 사이의 줄다리기 구간에 있습니다. 단기적으로 RSI와 온체인 데이터는 추가 상승 여력을 지지하고 있으며, 특히 1월 초의 강력한 기관 매수세는 하단을 단단하게 만들고 있습니다. 다만, 이번 주 예정된 PCE 데이터와 다보스 포럼은 변동성을 키울 수 있는 양날의 검입니다. 공격적인 추격 매수보다는 $94,500~$95,000 구간 지지를 확인하고 진입하는 것이 유리하며, 중장기 투자자에게는 50일 이동평균선($90,300) 위에서의 조정은 여전히 매력적인 축적(Accumulation) 기회로 판단됩니다."
구분, 가격레벨, 비고
강력 매수 구간,"$90,500 - $92,000",50일 이평선 및 20일 이평선 지지
추격 매수 구간,"$96,200 이상",저항선 돌파 확인 후 진입 (Breakout)
매도/차익실현,"$99,500 - $102,000",$100k 심리적 저항 및 매물대
핵심 손절 라인,"$89,800",50일 이평선 이탈 시 추세 훼손 간주
Year-end summaryThis scenario is a chart analyzed at the end of October. Smart money accumulated in the $80,000 range in March 2025 is being sold to individuals and falling sharply. If a short-term accumulation occurs at the current selling price, the price will fall again. If a long-term sideways accumulation period like March-April 2025 occurs (expected to be even tighter than March-April), the price is expected to rise again. Positions should be considered only for short-term trading, and trend judgments should be made after observing the accumulation period.

에릭 트럼프 한 줄에 26억이 움직였다? 폭락장에 터진 ‘현명한 거래’의 진짜 의미에릭 트럼프 한 줄에 26억이 움직였다? 폭락장에 터진 ‘현명한 거래’의 진짜 의미
시장이 그냥 빠진 게 아니라
진짜 박살 나던 날이었어요.
XRP가 2.14달러까지 밀리고,
비트코인은 9만1,900달러,
이더리움도 3,380달러까지 깨졌죠.
공포지수는 바닥.
다들 도망가던 그 새벽 6시 36분.
데이브 포트노이가 먼저 XRP 50만 달러.
6시 37분에 ETH 40만 달러, BTC 75만 달러.
6시 38분에 XRP 50만 달러를 한 번 더.
단 2분 동안 총 200만 달러.
그 중 XRP만 100만 달러.
비중으로는 XRP 50%, 비트코인 37.5%, 이더리움 20%.
그러면서 뭐라고 했냐면,
“거리에 피가 흐를 때 나는 상어처럼 달려든다.”
여기까지만 해도 꽤 세지만
진짜는 그 다음이에요.
다음 날 에릭 트럼프가 X에다가
“Smart trade @stoolpresidente”
딱 이 한 줄을 올립니다.
조회수 230만.
좋아요 9천 개.
그냥 덕담이 아니에요.
비트코인 17만~100만 달러를 공개적으로 말해온
대표적 강세론자가
“이 타이밍, 이 베팅 방향이 맞다”
공개 도장 찍어준 거거든요.
결과가 재밌습니다.
XRP 거래량이 24시간 안에 18% 튀었고
가격도 2.28달러까지 반등.
BTC는 9만3,500달러,
ETH는 3,450달러 선까지 회복했죠.
시장 입장에선 메시지가 하나에요.
누군가에겐 이 구간이 지옥이고
다시는 들어오기 싫은 공포 구간인데,
다른 누군가에겐
“세일 중인 우상향 자산을
할인된 가격에 쓸어 담는 자리”라는 것.
에릭 트럼프의 “현명한 거래” 한 줄은
폭락장을 리스크가 아니라
미리 선점하는 사람과
버티지 못하고 던지는 사람을
깔끔하게 갈라버린 상징 같은 말이 된 거죠.

ezETH 완전 해설 — 이더리움을 두 번 맡겨 복리로 불리는 리퀴드 리스테이킹 토큰의 모든 것
🔥 “ezETH 완전 해설 — 이더리움을 두 번 맡겨 복리로 불리는 리퀴드 리스테이킹 토큰의 모든 것”
1️⃣ ezETH는 쉽게 말해 ‘이더리움을 다시 맡겨 이자를 한 단계 더 버는 토큰(LRT)’이에요. 내가 이더리움(ETH)을 Renzo 플랫폼에 예치하면, 그만큼의 ezETH 토큰을 받게 돼요. 시간이 지나면서 이 토큰의 가치는 자동으로 오르는데, 예를 들어 1 ezETH가 처음엔 1 ETH였더라도 몇 주 후엔 1.02 ETH처럼 조금씩 늘어나요. 마치 은행 예금이 아니라, “이자를 자동으로 더해주는 이더리움 증서”라고 보면 돼요.
2️⃣ 운영 주체는 Renzo(렌조)라는 회사 로, 이들은 사용자가 얻는 보상 중 10%를 수수료로 가져가요. 이 중 절반(5%)은 Renzo 재단 트레저리로, 나머지 절반(5%)은 노드 운영자에게 돌아가요. 즉, 남은 90%의 보상 이 ezETH 보유자의 자산가치에 직접 반영되며, 매일 자동으로 누적돼요. 이렇게 시간이 쌓이면 복리 효과가 생겨서 장기 보유자일수록 수익률이 높아지는 구조예요.
3️⃣ ezETH는 단일 네트워크에 머물지 않아요. Ethereum 메인넷뿐 아니라 Arbitrum, Base, Blast, Binance Smart Chain(BSC), Linea 등 6개 이상의 체인에서 네이티브 또는 브릿지 형태로 유통돼요. 예를 들어 Arbitrum에서는 Aave를 통해 담보로 쓰이고, Base에서는 Aerodrome에서 스왑 거래가 가능하죠. 그래서 유저들은 어느 체인에서 거래하느냐에 따라 가스비·속도·유동성이 달라지기 때문에 체인 간 이동 전략 이 수익률에 큰 영향을 줘요.
4️⃣ 가격 안정 장치는 Chainlink(체인링크) 오라클이에요. 체인링크는 실시간으로 ezETH의 시세를 ETH와 비교해 계산하고, 이 데이터를 Aave·Spark·Compound 같은 대출 플랫폼에 제공합니다. 덕분에 ezETH는 단순 토큰이 아니라 공식적인 담보자산(콜래트럴) 로 인정받고, 안전하게 대출에 활용될 수 있어요.
5️⃣ 현재 시장 데이터로 보면, ezETH의 가격은 약 $4,196.50(약 580만 원) 이고, 유통량은 약 300,565개 , 시가총액은 약 12억 6천만 달러(약 1조 7천억 원) 예요. 24시간 거래량은 약 63만 달러(약 8억 6천만 원) 수준으로, 주로 트레이딩보단 예치·담보용 으로 사용되는 게 특징이에요.
6️⃣ 상위 보유자는 거의 모두 디파이 프로토콜이에요. Aave(33.1%), Renzo Lockbox(24.2%), Spark(5.2%), Compound(4.5%), 그리고 기타 대출 프로토콜들이 합쳐 상위 6개 주소가 전체 공급량의 95% 이상(약 28.7만 ezETH) 을 차지하고 있어요. 즉, ezETH는 일반 투자자보단 기관이나 프로토콜 중심으로 움직이는 구조예요.
7️⃣ 사용자 전략 중 핵심은 ‘루핑(Looping)’이에요. 예를 들어, 한 사용자가 10 ETH를 Renzo에 예치해 ezETH를 받으면, 이를 Aave에 담보로 맡기고 ETH를 대출받은 뒤, 그 ETH를 다시 Renzo에 넣어 또 ezETH를 받는 식이에요. 이렇게 반복하면 자산이 2배, 3배처럼 불어나며 더 많은 보상 포인트(REZ, EigenLayer 포인트 등) 를 얻을 수 있어요. 하지만 청산 위험도 함께 커지죠.
8️⃣ 가격은 기본적으로 ETH와 1:1로 움직이지만 완전 고정은 아니에요. 유동성이 줄거나 상환(언스테이킹) 대기 시간이 길어지면 ezETH가 ETH보다 약 1~5% 싸게 거래되기도 해요. 실제로 2024년 4월, AMEX:REZ 에어드랍 직후엔 대규모 매도로 ezETH 가격이 ETH 대비 –10%까지 하락(디페깅) 한 사례도 있었어요.
9️⃣ 리스크는 크게 세 가지예요. 첫째, AVS(Actively Validated Service)가 해킹되거나 실패하면 슬래싱(자산 일부 손실) 이 발생할 수 있어요. 둘째, 멀티체인 유동성 단절로 특정 체인에서 상환이 지연되거나 가격이 급변할 수 있고, 셋째, 브릿지나 오라클 오류 시 자금 이동이 막히거나 잘못된 가격이 전달될 수 있어요.
🔟 마지막으로 데이터를 분석할 땐 신중해야 해요. Arkham이나 Nansen 같은 온체인 툴로 “Top 25 홀더 변화량(+4,755 ezETH = 약 1,979만 달러)” 같은 데이터를 볼 수 있는데, 이때는 프로토콜 계약 주소를 제외하고 개인 지갑만 계산해야 정확해요. 또, 가격 환산은 반드시 Chainlink 오라클 기준가 를 써야 실제 시가와의 차이를 줄일 수 있어요.

XRP, 하루 5,000만 달러 쏟아내는 고래들 — 이건 단순 조정이 아니다🚨 “XRP, 하루 5,000만 달러 쏟아내는 고래들 — 이건 단순 조정이 아니다”
요즘 XRP 시장 분위기, 진짜 장난 아니다.
고래들이 하루에 5,000만 달러(약 690억 원) 씩 내던지고 있고,
가격은 $3 붕괴 → $1.25까지 급락했다가 $2.3대 반등 … 변동성 미쳤다.
이건 단순한 ‘출렁임’이 아니라, 자금 이동의 대전환 이다.
(이어서 계속👇)
1️⃣ 하루 5,000만 달러 순유출 💸
온체인 데이터 보면, 1,000만 XRP 이상 보유한 고래들 이
수주째 거래소로 자금 보내며 매도 모드 전환 했다.
이게 단순 일부익절 수준이 아니라 전략적 자산 재분배 움직임이야.
2024년 말 누적 매수했던 애들이 지금 정리 들어간 거다.
2️⃣ 거래소 입금 폭증 = 매도 신호 🚨
대규모 지갑들이 거래소로 XRP 보낼 때마다
그 다음날 대부분 단기 조정 → 저점 재테스트 패턴 반복.
최근 1주간 중앙화 거래소로 이동한 XRP 규모만 총 2.5억 달러 이상 .
시장 전체에서 가장 강한 매도 압력 걸린 코인이 지금 XRP다.
3️⃣ 기술적 구조 완전히 뒤집혔다 📉
20일 이동평균선(EMA) $2.906 하회 ,
단기 모멘텀 완전히 약세 전환.
일봉 엘더-레이 지수도 4일 연속 음수 확대,
빨간 히스토그램 길어지면서 “매도세가 시장을 장악했다”는 시그널 확정.
4️⃣ 지지선 $2.7435, 붕괴하면 $2.6371 경고 ⚠️
이게 ‘3개월 최저치’ 라인.
만약 이거 깨지면 시장 심리 급속히 식는다.
현재 RSI는 과매도(30 아래) 근처라
단기 반등은 가능하지만 “하락추세 속 기술적 튕김” 수준일 가능성 높음.
5️⃣ 바이낸스 오더북에 매수벽 100만 XRP 🧱
$2.7 부근에 100만 XRP 넘는 매수 주문 대기.
즉, 이 라인이 방어선 역할 할 수도 있다.
하지만 이 벽이 무너지면 하락은 $2.63까지 직행 한다.
6️⃣ ‘섹터 로테이션’ 시작됐다 🔄
최근 자금이 비트코인·솔라나 등으로 이동 중.
고래들이 “단기 수익률 좋은 곳으로 회전”하고 있는 거다.
즉, XRP에서 빠진 돈이 시장을 떠난 게 아니라,
다른 섹터로 옮겨타고 있는 구조적 순환 자금 이라는 뜻.
7️⃣ 위험관리·다각화 본능 발동 ⚖️
수개월 누적매수로 평균단가 낮춘 기관들이
지금 익절 + 포트폴리오 재조정 들어간 거야.
“집중된 리스크 줄이기” — 완벽한 리스크 매니지먼트 움직임.
이건 공포가 아니라, 프로의 행동 이다.
8️⃣ 기관, 오히려 매수 중이라는 역설 💼
CME XRP 선물 미결제약정(OI) 10억 달러 돌파 ,
전년 대비 +120% 증가 .
개인들이 흔들릴 때 기관은 조용히 담고 있다.
이게 진짜 “똑똑한 돈(Smart Money)”의 패턴이지.
9️⃣ ETF 트리거: 10월 25일 전후 ‘결정의 날’ ⏰
현재 SEC가 그레이스케일·위즈덤트리·비트와이즈 등
6개 자산운용사의 XRP 현물 ETF 심사 중 .
특히 커버드콜형·분배형 구조까지 제출돼 있어서
“ETF 승인 시, 전통 자금 대량 유입” 시나리오가 현실화될 수 있음.
🔟 다음 스테이지는 ‘대형 리스크·대형 기회’ 🎯
지금은 고래의 매도와 기관의 매수가 부딪히는 교차점 .
$2.6371 깨지면 패닉,
$2.906 돌파하면 반전.
10월 25일 ETF 발표 전까지 시장은 ‘심리 게임의 극단’ 으로 갈 거다.
이걸 견디는 사람만 다음 랠리를 본다.
🔥 결론
XRP는 지금 “두 개의 거대한 손”이 줄다리기하는 구간이다.
한쪽은 익절하는 고래 , 다른 쪽은 조용히 쓸어 담는 기관 .
숫자는 거짓말하지 않는다 —
하루 5,000만 달러의 매도, 10억 달러의 선물 포지션, $2.7의 전쟁선.
지금 이 싸움의 끝은, 곧 “ETF 승인일”이 알려줄 거다.

솔라나가 반등을 보여주면 무슨 일이 일어날까? SOLUSDT Swing Chart솔라나는 이더리움과 더불어 이번 하락에서 가장 많이 욕을 먹었던 프로젝트 중 하나입니다.
펌프펀의 무분별한 밈코인 발행, 트럼프 코인 이슈 등 여러가지 많은 이슈가 있었고, 그 이유에선지 솔라나를 이더리움과 함께 조롱하는 사람들이 많아졌다는 것을 인지했습니다.
위와 같은 이유로 솔라나의 반등 가능성에 대해 찾아보았고, 몇 가지 좋은 모습이 관측되었습니다.
첫 번째 이유는 BSL Sweep으로 인한 하락의 종료입니다. 저는 보통 상/하단(BSL, SSL)에서 유동성 제거(liq Sweep)이 나오면 이 하락이 어디까지 내려갈지 관찰합니다. 그리고 보통 두가지로 판단합니다.
예를 들어 BSL에서 유동성 제거가 나왔을 때 SSL까지 가격이 내려갈 수 있을지 판단합니다.
BSL<->SSL을 하나의 레인지로 설정하고, 해당 레인지의 50%를 기준으로 반등자리를 모색합니다.
2번일 경우 또 이야기할 수 있는 부분이 좀 많아집니다만, 간다하게만 말씀드려보면 ICT이론에서 나오는 프리미엄 존을 통해 반등할 수 있다라는 가능성을 열어두고, 그 안에서 볼 수 있는 여러가지 자리들을 탐색합니다.
프리미엄존은 쉽게 말해 세력(Smart Money)들이 가격이 반전되었을 때 잡아둔 포지션을 정리할 수 있는 구역입니다. 세력들 또한 잡아둔 포지션을 매도해야지만 수익을 챙길 수 있습니다. 그리고 BSL에서 잡아둔 매도 포지션은 아마도 꽤나 큰 물량일 것이고, 이에 대한 포지션을 종료한다면 매도 압력이 줄었다는 결론으로 도달할 수 있으며 이렇게 되었을 때 가격의 상승을 기대할 수 있습니다.
제가 생각하는 현재 솔라나 차트는 BSL에서 나온 유동성 제거로 발생된 되돌림 이후 프리미엄 존에 도달했다고 판단하고 있으며, 하모닉 패턴중 Shark Pattern이 관측되어 반등 가능성을 열어두고 있는 상황입니다.
하모닉 패턴(Harmonic Pattern)은 피보나치 비율을 기반으로 한 차트 패턴으로, 특정 가격 움직임을 통해 반전(reversal) 가능성을 예측하는 기술적 분석 기법입니다. 하모닉 패턴은 시장에서 반복적으로 나타나며, 특정한 피보나치 비율을 만족했을 때 관측되는 규칙을 패턴화 시켰다고 보시면 됩니다.
또한 하모닉 패턴의 타겟 포인트는 일반적으로 크게 4가지로 잡아볼 수 있습니다.
XABCD포인트 중에서 C Point와 D Point를 피보나치 되돌림 툴로 측정했을 때 38.2%/50%/61.8% 순서대로 3가지 타겟이 나오며, 가격 되돌림이 제대로 나온다면 최대 D Point까지 볼 수 있습니다.
마지막으로 저는 해당 패턴의 D Point를 현재 저점인 125.52$로 판단하고 있으며, *개인적으로 해당 가격이하로 가격이 하락한다면 X Point 밑까지 내려올 수 있을 것으로 보고 있습니다.
Harmonic Shark Pattern의 C-D의 길이는 0.886%에서 최대 1.13%까지 나올 수 있습니다.
글을 마무리 지을 때마다 어떻게 마무리를 지어야 좋을지 고민하고 있습니다만,, 쉽지가 않은 것 같습니다.
이번 관점 또한 개인의 의견일 뿐이니 가벼운 마음으로 훑어봐주시면 좋을 것 같습니다.
감사합니다.

억남샘의 2월 8일자 비트코인 도향분석에 대한 해석 (엘파 교육용 아이디어) 간혹 개인 메세지로 트레이딩 관련해서 직접적으로 포지션을 물어본다던가, 자신이 투자로 많은 돈은 잃었는데 도와달라는 요청들이 있는데, 제발 스스로 공부해서 자신만의 매매법을 가졌으면 하는 마음에서 매억남 스승의 분석을 내 나름대로 해석에서 종종 공유할 생각이야. 아무래도 오래 분석방송을 하신 만큼 너무 반복되는 내용은 언급하지 않을 때도 종종 있고, 엘리어트파동이론에 근거한 분석은 경험에서 나오는 확률이 높은 경우의 수를 공유하는 거라 봐도 무방한데 리딩으로 받아들이는 형들이 있는 것 같아 아쉬워.
이렇게 이야기해도 리딩처럼 남의 분석을 가져가려 하면 깡통차기 쉬우니까 명심하길.
I’ve been getting some DMs asking for my exact positions or even requests for help after losing a lot in trading. Honestly, I really hope you guys take the time to study and develop your own strategies instead of relying on others.
That’s why I’m planning to share my own interpretations of Maeuknam’s (매억남) analysis from time to time. Since he’s been doing market analysis for a long time, he sometimes skips over things that might feel repetitive. His analysis, based on Elliott Wave Theory, is essentially about sharing high-probability scenarios from experience—but I’ve noticed some of you taking it as straight-up trade signals, which is kinda frustrating.
Even if I keep saying this, some of you might still treat other people’s analysis like a trading signal. But if you do that, it won’t end well. So, be smart and make sure you’re actually learning, not just following blindly.
억남이형의 2월 8일자 분석을 보고 온 형들이 본다고 생각하고 내 해석을 공유할게.
나도 그와 생각이 100% 일치하지는 않으니까, 나와 생각을 달리하는 해석이 있다면 댓글은 환영이야.
For those of you who checked out Maeuknam’s Feb 8 analysis, I’m gonna share my own interpretation of it.
I don’t agree with him 100% on everything, so if you’ve got a different take, feel free to drop a comment. Always down for a good discussion! 👊

나스닥 가불기그동안 애써 외면해왓던 것들이 막힌 하수구속애서
슬슬 역류해오고잇다.
특시 올해 1월애 들어서 호황이 온 것애 대해
찐바닥인거처럼 보여 오르면서
다들 숏squeeze까지 겹쳣다고 말할 수 잇다
but, 조금 더 다른 점애 focus 를 둬본다
우선 개미들이 smart 해졋다는 점
최근 거래의 성질이 점점 변화하고 잇다는 점을
주시중이다
1 2 3 4 의 거래량을 확인해보자
원래 떨어지면 줍기쉽고 오를수록 사기힘들다
개별주식은 그마다 다 다르갯지만
핼스 3대 500, 다마 300점, 카트라이더 L1마앰블, 롤 그마이상 가치
어느정도 수준이 올라온 사람이라면 이해할 것
'내가 주식경력 십년 넘었내~' 이러는 똥구력은 인정해주지안는다
지금부터 중졸 고졸(상고재외 why? DJ, MH 배출)과
얘채능 문과(상경대 재외)는 접근금지
다시 돌아가서
미래 생산직 딸깍이들을 털어내고 딸배 잘가고
치킨도 먹는사람이 있으면 튀기는 사람도 있어야지
다 먹기만 할 수 없으니까 (글쓴이 현대차 생산직 지원함)
거래량을 구분구적분으로 보고 y=f(x)를 구해서
1 2 3 4 를 미분해서 접선의 기울기를 봐봐
1도 0이야 2도 0이야 3도 0이야 4도 0이야
앵? 엉님?? 기울기 다 똑같은대요??
어휴 한심한 놈 그러면서 담배 뻑뻑 피면서
아 왜 올라 (뻐끔) 아 왜 내려가 (뻐끔)
집 천장 뿌수고 문뿌수고
한심한 벌래 가튼 놈 모니터 뿌수고
준위가 다르다는거애요 준위가
1번이 n=1 이고 2 3 이 n=2,3 ㅇ면 머야
4는 머냐고 눈있으면 봐라 n=7 주기 라듐이애요 라듐
나스닥 들고 있으면 방사선 피폭되서 죽어요 죽어
여기서 어이쿠나 돌파하내 하면 들고 죽는다니까?
사람들이 하나는 알고 둘은 몰라요 시장이바껴도
모든 만물의 법칙은 Truth 불안정한 상태애서 바닥으로 떨어져
안정상태가 된다는 이말입니다 침팬치들은 몰라요 이걸
그래서 10k가 바닥이다??
'바닥밑애 지하가 잇다'
전 히말라야 반지층애 살아요 반지하 아닙니다 돈더주고
반지층으로 이사왔어요
반지하라면 바닥이라고 생각하갯죠
나 시그니앨 팬트하우스 살아요
다시 곰곰히 생각해보니
어,, 시그니앨 팬트하우스가 히말라야 반지층보다 높나??
결국 우리는 지금 히말라야 반지층이애요
바닥이라고 생각했던곳이 사실 애배르스트 엿던거지
포탠셜 애너지가 다시 쭉쭉 생기내
위험한 상태 떨어지고시픈걸??
지금 미국은 가불기가 걸렸죠
은행들 하나둘 터져나가고
25bp가 정배라매 ㅈ지금까지 25bp면 환호를 햇죠
과연 지금도 과거와 가틀까???
그럼 금리 안올려바 더 ostensibly호재지 근대 그개 호재일가??
자내는 스태그 플래이션도 모르나?? 그것도 모르고 우끼끼 롱버튼을 누른다?
침팬치한태 자위하는 법을 알려준뒤로 죽을 때까지 자위만하다 죽는거처럼
죽을때 까지 롱버튼만 누르고 죽는겁니다.
아니 엉님
결국 시장은 커져가니까 우상향이라매요
나중애 결국 탈출 아님?
그쵸 근대 사람들이 어디 물려있나 알아야대요
어디서 물렷을까 15000? 지금 물좀 타니까
평단 내려가서 살맛나고 조치?? 막 근질근질 거리지
어 나스닥 9k 쭉쭈욱 쑥쑥
중력의 힘이 쌔지고 지구가 날 잡아 당기내(와장창~)
여기서 금리 인하까지하면 미국이 더이상 못버틴다는 소리갯죠
전새개 천명하고 미국은 돈도 굳내~ 수퍼볼은 광고비만 1조짜리 매진이라는대
60억지구 아니 80억 온동내 옆집 시골 춘자 할매도 미국 대곰탕 잔칫날이라고
숟가락 들고 올라하니 슈ㅜ퍼볼 완전 물로캣이내~
결국 나스닥 숏 비트롱 치라는 말 박애 못하갯습니다
사람들이 은행들 터지는대 비트 외오르냐 외오르냐 할대
14일부터 목이터져ㅕ라 울부짖엇어요
전갤 가시면 찾아볼수잇슴니다
결국 그동안 막혀온 하수구 터져서
변기 똥창나고 모두 죽슴니다
다들 조심하새요

CAD/CHF - Smart Money Concept1. 프라이스 액션 및 패턴
- 1일 : 지지 구간
- 4시간 : 하락 추세
- 15분 : 추세 전환
2. 확인 시그널
- 1분 차트상 추세 전환
3. 참고
-
4. 거래 전략 설명
- 1일 차트 지지 구간에서 만들어진 15분 차트의 추세전환
- 가격이 오더 블럭에 진입하면 1분 차트에서의 추세전환 식별 후 오더 블럭 설정

46 주차 [On-chain 글래스노드 주간 뉴스레터] FTX의 몰락
안녕하세요 :) Yonsei_dent 입니다.
Glassnode Insights 플랫폼의 주간 뉴스레터를 번역 / 분석해보는 시간이 찾아왔습니다.
악몽과도 같았던 지난 한 주였습니다. FTX 거래소의 붕괴와 함께, 디지털 자산 업계는 마운트곡스 사태 이후 가장 충격적인 사건을 경험했습니다. 특히, 투자자들의 자산을 관리하는 기관의 파산이라 충격은 더욱 심했습니다. 이번 보고서에서는 FTX 뱅크런, 투자자들의 셀프-커스터디 (Self-Custody : 금융자산을 다른 기관에 대신 보관ㆍ관리 위탁하는 것이 아닌, 본인이 관리하는 것) 추구 및 BTC 관련 세력들의 반응 에 대해 면밀히 살펴보겠습니다.
-----------------------------------
------------------------------------
0. 서론 및 간단 정리 & 오늘의 추천 메트릭
<46주차 결론>
1) FTX 사태는 시장에 큰 충격을 주었다.
2) 온체인 지표 상, FTX가 5-6월 부터 수상한 모습을 보임을 알 수 있었다.
3) 현 사태는 거래소로의 전반적 불신으로 이어졌다.
4) 거래소에서 BTC, ETH는 유출되고 있고, 스테이블 코인은 반대로 유입 중이다.
5) 스테이블 코인의 유입 증가는 스마트 계약을 통한 유동화의 일환이다.
6) BTC, ETH 등을 자가 보유 (Self-Custody) 하려는 경향은 늘어나고 있다.
7) 거래소의 신뢰는 무너졌으나, 코인 자체의 신뢰는 아직 남아있다.
8) 다만 충격이 큰 탓인지, LTH & HODLer 집단의 동요가 나타났다.
9) 아직 우려할 단계는 아니나 해당 집단의 상황을 모니터링 하여야 한다.
10) 이 역경이 지나가면 시장은 다시 단단해질 것이다.
--------------------------------------------------------------
<오늘의 추천 메트릭>
“Exchange Net Position Change (Balance)”
이번 FTX 사태가 거래소 관련 문제이니 만큼, 거래소와 투자자들의 상황을 한 눈에 볼 수 있는 지표가 필요할 것입니다.
Net position change는 +0 을 기준으로 하여, 양의 값 (+)🟢인 경우, 거래소에 유입되는 가상자산이 증가하여 잔고가 증가 함을 의미합니다. 반대로 음의 값 (-)🔴인 경우, 유출로 인해 잔고가 감소 함을 의미합니다.
현재 거래소에 대한 신뢰도의 하락 및 자체 코인 보유 경향이 늘어나면서 Exchange Balance Net Position은 음의 값을 보이고 있습니다.
---------------------------------------------------------------
자! 이제 본론으로 넘어가겠습니다.
지난 11월 6일~14일 사이에 휘몰아친 폭풍은 충격적이었습니다. 무엇보다, 자산을 보관하고 거래를 중개해야할 거래소의 신뢰를 상실했다는 점에서 실망스러운 일이라 할 수 있었지요. 불과 일주일 만에, 메이저 거래소 중 하나였던 FTX가 몰락하면서, 다음과 같은 실체가 드러났습니다.
1) 거래소 이용자들의 뱅크런
2) 거래소의 고객 인출 서비스 중단
3) Binance 거래소와의 인수 논의 부결
4) 고객 관련 자금이 실제로는 80~100억 달러 가량 부족한 상황
5) 거래소 지갑이 5억 달러 어치의 해킹을 당한 내력
6) 자회사 FTX US와 함께 파산 신청
7) Alameda, FTX 법인의 불법행위
이는 비단 FTX 거래소 뿐 만 아니라, 가상자산 업계 전반에 막대한 타격을 주는 일이었으며, 수백만 명의 고객에게 지급해야할 자금은 정체되었습니다. 더 큰 문제는, 크립토 시장에 대한 신뢰와 평판이 무너졌다는 사실 입니다. 거래소의 “관리” 측면의 실패로 접근할 때, 2013년 마운트곡스 사건이 데자뷰처럼 떠오르는 일이라 할 수 있습니다.
유념해야 할 점은, 이번 사태를 암호화폐 자체의 기술적 (암호화) 문제가 아닌, 중앙 집중식 거래 매개 및 관리 체제의 실패로 접근 하여야 한다는 사실입니다. Bitcoin을 위한 구제금융은 기대할 수 없으며, 크립토 업계 전반에 걸친 디레버리징 (Deleveraging)의 여파는 고통을 수반하긴 하나 그 동안 쌓여왔던 버블을 하나 둘 걷어낼 것입니다. 이제 안전한 거래와 자산 가치를 지키기 위해, Proof-of-Reserves (교환 준비금 증명) 방식이 대두 될 것이며, 시장은 자체적인 조정과 발전을 통해 앞으로 더욱 단단해 질 것입니다.
이번 보고서의 주안점은 다음과 같습니다.
1) FTX 온체인 지갑 상 관찰되는 뱅크런은 구체적으로 어떤 양상인가?
2) 거래소 잔고 (Exchange Balance)에 미친 영향과 셀프-커스터디 (Self-Custody)로의 변화의 바람
3) BTC 장기 보유자의 확신 (Conviction) 에 미친 영향은 어느정도인가?
---------------------------------------------------------------
---------------------------------------------------------------
I. Fractional Reserves : 조각난 거래소 보유금
FTX 거래소 대차대조표 상, 어떻게 80억~100억 달러에 달하는 막대한 고객 예치금이 새어나갈 수 있었는지는 차차 시간이 지나면 밝혀질 것입니다. 여러 증거와 정황 상, 모회사 격인 알라메다 (Alameda Research)를 통해 자금을 유용한 정황 역시 드러난 상황이지요.
● 요약 : FTX, 알고보니 5-6월 경부터 BTC 잔고 측면에서 수상한 낌새가 있었습니다.
FTX 거래소 보유량을 추적하는 것은 사실 쉽지 않은 일이었습니다. FTX가 BTC 보유 시, 추적이 쉽지 않은 Peeling Chain System을 사용하고 있었기 때문입니다. 2022년 4월~5월 까지, Glassnode가 추적 가능했던 BTC 보유량🟠은 10만 2000개 가량으로 정점을 기록했습니다. 이후 6월 말, 51.3% 가량이 급격하게 감소🔴 했습니다.
이후 보유량은 지속적으로 줄어들면서, 이번 주에 들어 바닥을 드러냈습니다. . Alameda가 고객 예치금을 다른 곳에 사용하였다는 주장이 사실로 밝혀지면서, Alameda-FTX 법인이 실제 LUNA, 3AC 및 기타 대출 기관이 파산한 이후 5-6월 상 심각한 대차대조표 상 손실을 기록했음을 추측할 수 있습니다.
● 요약 : FTX 거래소 내의 ETH도 BTC와 마찬가지였던 상황
FTX가 보유하던 “ETH 공급량”🔵역시 2회에 걸쳐 크게 감소🔴했습니다.
1) 2022년 6월 : ETH 보유량 57만 6천개 감소 (-55.2%)
2) 2022년 11월 : 61만 1천 개 → 2천 8백 개로 감소 (-99.5%)
BTC와 마찬가지로, FTX에는 뱅크런에 의해 ETH 마저 동난 상태임을 알 수 있습니다.
● 요약 : FTX 스테이블 코인 흐름을 보면, 5-6월에 ETH, BTC 담보로 스테이블 코인 대출 등을 시도했음을 알 수 있습니다.
스테이블 코인 보유 상황을 살펴볼까요? 10월 19일 부터 크게 감소하기 시작하였는데, 7억 2,500만 달러에서 거의 “0” 수준으로 급격하게 감소한 것을 볼 수 있습니다.
6월 루나 사태로 인한 매도세 (Sell-off) 이후, 스테이블 보유량은 상당히 증가했더 사실이 확인되는데요, FTX가 대차대조표 상의 손실을 무마하기 위해, BTC, ETH 등을 담보로 스테이블 코인 스왑 (Swap) 또는 대출을 시도했던 정황 으로 볼 수 있습니다.
FTX-Alameda 사이에 정확히 어떤 일이 있었는지는 아직 알 수 없으나, 5-6월부터 천천히 무너지기 시작했음을 알리는 신호들이 온체인 상 나타나고 있습니다.
---------------------------------------------------------------
---------------------------------------------------------------
II. Safety in Self-Custody : 셀프-커스터디의 안전성
● 요약 : 거래소 신뢰가 바닥으로 떨어져, Self-Custody가 대세를 이루고 있습니다.
가산자상 시장 전반에 “거래소”에 대한 불신이 팽배하자, 자산을 안전하게 관리하기 위해 셀프-커스터디 (Self-Custody) 경향이 급속도로 확산 되었습니다. 이에 전체 거래소 코인 인출량은 역대 수준으로 증가한 상황입니다. 위 차트는, FTX 붕괴가 본격적으로 시작되기 전인 11월 6일 까지의 거래소, 투자자 지갑 및 채굴자 간의 총 잔액 보유 변화를 나타내고 있습니다.
거래소의 경우, 단 7일 만에 총 BTC 잔고가 72,900 BTC 감소🔴하여 역대급 감소세 를 보였습니다. 과거 2020년 4월, 2020년 11월, 2022년 6월 ~ 7월을 제외🔵하면 이 정도로 가파르게 유출된 내력은 없었습니다.
● 요약 : BTC, ETH와 같은 탈중앙 암호화폐는 거래소로부터 인출을, 스테이블 코인은 거래소에 예치하는 경향이 주를 이루고 있습니다.
BTC, ETH가 전체 거래소에서 다량 유출되었던 반면, 스테이블 코인은 11월 10일 기준, USDT, USDC, BUSD 및 DAI를 합쳐 총 10억 4천만 달러가 넘는 양이 거래소로 유입🟢 되었습니다. 이는 역대 7번째로 높은 일일 순 유입량이었습니다.
● 요약 : 거래소로의 스테이블 코인 공급량이 급증했는데, 그 중 Binance의 BUSD가 대세를 이루고 있습니다.
이로 인해 모든 거래소 보유고에서 보유하고 있는 스테이블코인이 사상 최고치인 411억 8600만 달러🔴로 늘어났습니다. 특히 BUSD🟡가 214억 4천만 달러가 넘는 보유액을 보이면서, 지배력 (Dominance)이 눈에 띄게 증가한 것을 볼 수 있습니다. 이는 Binance 거래소가 최근 스테이블 코인을 BUSD로 통합함과 동시에, 세계 최대 거래소의 입지를 보임 에 따라 지배력이 커진 결과로 보입니다.
반면 USDT🟢보유량은 소폭 감소했으며 USDC🔵의 경우 최근 몇 달 동안 더욱 급격하게 감소하여, 스테이블 코인 시장 선호도가 점차 변하는 중임을 알 수 있습니다.
● 요약 : 스테이블 코인 유입의 증가는 결국 현금화를 위한 것으로 보입니다.
문제는, 이러한 스테이블 코인 상당량이 스마트 계약 (Smart Contract)을 통해 유출 되고 있다는 사실입니다. 매월 $4.63B의 비율로 ETH 스마트 계약을 통해 현금화 하려는 수요가 폭증했다는 의미입니다. 현 사태로 인해 달러 유동성 (Dollar Liquidity) 수요가 극에 달함을 알 수 있습니다.
● 요약 : 하지만 BTC, ETH 등의 보유 경향이 늘어난 것을 볼 때, 거래소의 문제로 여길 뿐 가상자산 자체에 대한 불신까지 번지진 않은 것으로 보입니다.
결론적으로 시장 상황은, 중앙 체제에서 발행한 “스테이블 코인”은 거래소로 유입 되는 중이고, 탈중앙화 자산의 대표 주자인 “BTC, ETH”는 인출 되는 모습을 보여주고 있습니다.
위 차트는 거래소 구매력 (Buying Power)의 변화 정도를 확인할 수 있습니다.
1) 하단 바코드 형태 차트 : 🟧 주황 영역은 BTC & ETH의 순 유입이, 🔲은 순 유출이 일어남을 나타냅니다.
2) 상단 오실레이터 형태 차트 : 스테이블 코인의 순 유입량에서 BTCÐ 흐름을 뺀 값 (USD 기준) 입니다. 양수 값 🟢의 경우 스테이블 코인을 구매할 여력이 증가한 것으로 간주합니다.
우선 전반적으로 스테이블 코인의 ‘구매력 (Buying Power)”이 월 당 $4.0B 가량 증가했음을 알 수 있습니다. 거래소로 스테이블 코인의 유입이 훨씬 크다는 것이며, BTC, ETH의 유출 경향은 매도 대신 “보유”를 하려 하는 것으로 해석할 수 있습니다. 이것은 현 사태에도 불구하고, 투자자들이 가상자산 (BTC, ETH) 보유를 선호 한다는 것을 말해줍니다.
즉, 투자자들이 일련의 사태를 거래소의 문제일 뿐 BTC, ETH 자체의 문제로 여기지 않았다는 사실로, 자체 보유 및 관리 (Self-Custody)를 통해 안전성을 추구하는 시장 변화라 할 수 있습니다.
---------------------------------------------------------------
---------------------------------------------------------------
III. Bitcoin Balances Swell : BTC는 지갑에 쌓이는 중
● 요약 : TAS 상, 거의 모든 집단이 보유량을 막론하고 매집세로 돌아섰습니다.
이토록 다량의 BTC가 거래소에 유출되면서, 모든 크기의 지갑 (고래, 새우 등)에서 뚜렷한 변화가 관찰되었습니다. 새우 : Shrimp(< 1 BTC)에서 고래 : Whales(> 1k BTC)에 이르기 까지, 온체인 지갑 상 BTC 잔고의 증가🟦를 나타내었습니다. 일부 집단의 경우 최근 몇 달 간 분배 (Distribution) 🟥 경향을 보이기도 하였으나 현재는 180도 바뀌어 모두 축적 (Accumulation)을 시도하고 있음 을 알 수 있습니다.
● 요약 : 새우 (1< BTC) 들은 열심히 BTC 매집 중입니다!
새우 : Shrimp (< 1BTC) 들의 경우, 이번 주에만 33.7k BTC를 매집🟢하여 지난 30일 동안 +51.4k BTC 🟠만큼 증가 했습니다. 이 수준의 잔고 증가를 보인 것은 2017년 강세장 정점 이후 두번째입니다.
● 요약 : 1~10 BTC의 게 집단도 매집 양상을 보입니다.
게 : Crab ( 1 ~ 10 BTC ) 집단 역시 공격적 축적 양상을 보이고 있습니다. 거래소에서 48.7K 가량을 인출하면서 2017년 강세장 고점 당시 수준에 근접하고 있습니다. 게 + 새우 집단 (10 BTC 미만)의 BTC 보유량은 현재 전체 순환 공급량의 15.9% 이상 을 차지하고 있으며 사상 최고 수준입니다.
● 요약 : 10~1,000 BTC 집단 (물고기, 상어) 도 매집해오고 있었습니다.
10~1,000 BTC 가량을 보유하는 집단은 물고기 / 상어 (Fish / Shark) 집단이라 합니다. 주로, 부자 개개인이나 무역 회사, 기관 투자자 등에 해당합니다. 몇 달 동안 잔고 증가세가 둔화되었는데, 이번 주에 78.0k BTC의 상당한 잔고 증가를 나타냈습니다. '일단 쌓아두고 보자' 라고 생각하는 것 같군요.
● 요약 : 고래도 역시나 매집을 해왔습니다. (이번 주는 약간 주춤했네요)
1,000 (1k) 이상 보유한 고래 (Whale) 집단의 경우, 해당 세력들의 투자 활동에 촛점을 맞추기 위해서 거래소로 직접 유입 / 유출되는 코인량만을 고려했습니다. 고래는 근 몇 주 간 지속적으로 매집을 시도하였으며, 30일 간 잔고는 53.7K BTC 가량 증가하였습니다.
다만 이번 주의 경우 다른 집단에 비해 약한 3.57K 가량의 증가를 보였습니다.
● 요약 : 채굴자은 수익성이 악화되어 BTC를 시중에 매도하고 있습니다.
자, 마지막으로, BTC 잔고 변화의 마지노선이라 볼 수 있는 채굴자 (Miner) 들의 상황을 살펴봅시다. 이미 일부 채굴 업계들은 경영난에 시달리고 있으며, 최근 BTC 급락마저 덮쳐 극심한 스트레스를 받고 있습니다. 해시 당 가격 (Hash Price)은 사상 최저치를 기록하였고, 채굴자들은 이번 주에 그들 자산의 9.5% 가량에 해당하는 7.76K BTC 가량을 매도하면서 버틸 수 밖에 없었습니다.
이는 2018년 9월 이후, 가장 급격하게 감소한 상황 이며 채굴자들이 현 경기에 순응 (Pro-cyclical)하는 모습을 보인다 할 수 있습니다.
---------------------------------------------------------------
---------------------------------------------------------------
IV. HODLers Resolve : HODLer 들의 의지는 여전할까요?
● 요약 : LTH, HODLer 집단도 이번 FTX 사태는 좀 충격적이었던 모양입니다.
이번 보고서 마지막 챕터로는, BTC HODLer 집단이 어떤 자세를 취하고 있는지 다루어보도록 하겠습니다. 워낙 FTX 사건의 여파가 크기에, HODLer 집단이 시장 확신 (Conviction)을 상실하였을 수 있기 때문입니다
보통 장기 보유자 (LTH) 들은 일정 수준의 가격 하락에도 쉽게 매도하려 하지 않습니다. 하지만 최근 LTH 보유 BTC Supply 값이 11월 6일 이후 일시적으로 하락🟠하는 모습을 보이고 있습니다. 지난 7일 간, 48,100 BTC 가량🔴을 매도하였는데, 아직 걱정할 수준은 아니지만 유의할 만한 수치입니다. LTH 집단의 신념 (conviction)이 무너진 상태는 아니지만, 지속적으로 LTH Supply 값이 감소한다면 이를 의심 하여야 할 수 있습니다.
● 요약 : 확실히 오래된 코인들이 시중에 유출되고 있습니다. 우려할 단계는 아니나 장기 보유자 집단이 동요하고 있음을 알 수 있습니다.
위 차트는 1년 이전에 이루어졌던 (Revived) 코인 공급량을 주 단위로 더한 값을, 4년 기준 표준 분포 값 (Z-score)으로 변환한 것입니다. 지난 한 주간, 97.45k BTC 가량의 오래된 코인 (1yr+)들이 유동화 된 것 을 확인할 수 있습니다.
4년 기준 Z-socre로 +0.83의 표준편차를 보이고 있습니다. 아직 역대급 규모는 아니나 유의미한 수준이기에 직전 LTH Supply 변화와 마찬가지로 지속적인 관찰이 필요할 것입니다.
● 요약 : Dormancy (휴면 기간) 지표는 소비된 BTC 들의 평균 나이 (Age) 정도로 볼 수 있습니다. 오래된 코인들이 지출됨을 의미하는데, 지표가 최근 급등한 상태이나 예전만큼 우려할 수준은 아직 아닙니다.
소비된 BTC의 평균 나이 (Age)는 이번 주 “90일”🔴을 조금 넘겼습니다. 이는 9-10월에서 보인 값🔵의 3배 가량으로, 오래된 코인들의 사용량이 점차 늘어나고 있음을 의미합니다. 휴면기간 (Dormancy)🟠지표는 보통 항복 매도세 (capitulation) 이벤트나, 상승장에서 이익 실현 시 증가하는 지표로, 현재 보이는 급증세는 HODLer 집단에게마저 패닉이 전파되고 있음 을 의미합니다.
● 요약 : CDD 상에서도, HODLer 집단이 동요한 것을 알 수 있습니다. 아직 걱정할 단계는 아니나 유의하여야 합니다.
마지막으로, CDD (Coin-Days Destoryed) 의 주간 합계를 살펴보겠습니다. Z-score로 표준편차를 나타내고 있으며, 이번 주 평균보다 1.9+ 가량 벗어난 경향을 나타내고 있습니다. 이번 주 총 1억 6,500만 일 (Days)에 해당하는 값이 소실 (Destroyed) 된 것을 알 수 있는데요, 1년 간 보관된 45만 2천 개 가량의 BTC가 지출된 것과 맞먹는 값입니다.
결론적으로, HODLer 집단 내에서도 어느정도 시장 패닉을 겪은 것으로 보입니다. 그러나 그 규모를 볼 때, 예상 범주를 크게 벗어난 것은 아니기에 아직 우려할 단계는 아닙니다. 다만, 현 상황이 몇 주 안에 완화되지 못한다면 우려가 현실이 될 수 있겠지요.
따라서 지난 7일 간의 BTC 급락은 “추세”가 아닌 FTX 사태로 인한 일시적 “이벤트”로 보아야 하겠습니다. 단, 오래된 코인 (old coin)들의 지출 경향 상승과 LTH Supply의 감소 를 토대로, 시장 확신 (Conviction)의 상실이 일어나지 않는지 지켜보아야 할 것입니다.
---------------------------------------------------------------
---------------------------------------------------------------
V. Summary and Conclusions : 요약 및 결론
FTX 사건을 통해, 가상자산 업계의 실태를 알 수 있었습니다. 이용자들의 신뢰를 기반으로 하는 거래소가 오히려 투자자들의 자금을 갉아먹었던 본 사태는, 어찌보면 결국 일어날 참극이었을지도 모릅니다. 그래도, 산불이 지나가면 다시 숲이 자라나듯이 BTC와 가상자산 업계는 더욱 강하게 일어설 것입니다.
늘 그래왔듯이, 시간과 모두의 노력은 상처를 아물게 할 것이며, 가산자상 시장은 더욱 강해져서 돌아올 것입니다.
---------------------------------------------------------------
▶ 코멘트 : 참으로 힘든 한 주 였습니다. 곪은 상처가 FTX를 통해 드러났고, 우리 모두 경각심을 일깨우는 시간이었다고 생각합니다. 그래도 역시 글래스노드 팀은 항상 긍정적이네요! 쓰러져도 일어서는 오뚜기처럼, 포기하지 말고 조금씩 다시 이어나가 봅시다.

39 주차 [On-chain 글래스노드 주간 뉴스레터] 비트코인은 디톡스 중..!
안녕하세요 :) Yonsei_dent 입니다.
Glassnode Insights 플랫폼의 주간 뉴스레터를 번역 / 분석해보는 시간이 찾아왔습니다.
비트코인 (이하 BTC)은 지난 한 주간 20K 저항에 부딪히며 횡보하는 양상을 보였습니다. 이에 따라 단기 보유자 (STH) 들이 미실현 손실을 입은 상황입니다. 다행인 점은, 9월 27일 현재 2일 연속 반등하면서 20K 저항을 돌파할 것으로 기대되고 있습니다.
1년 넘게 이어지는 하락장 와중에도, HODLers (매수 후 손실을 입더라도, 이익 실현 때까지 우선 코인을 보유하는 집단 : 속칭 “존버”족) 의 상승에 대한 믿음은 여전히 확고합니다.
BTC 관련 여러 온체인 지표에서도 이제 큰 주기에서 “Detox : 해독” (투기 경향이 줄어들면서 네트워크 생태계가 초기 BTC 수준으로 회귀, 가격대 역시 바닥을 다지는 과정 - 역자) 이 일어나고 있음을 확인할 수 있습니다.
즉, 단기 투기성 소액 투자자들은 시장에서 걸러지고 보다 장기적으로 보유하려는 경향이 대세가 된 셈입니다.
BTC, 이제는 정말 바닥을 다 다진 것일까요?
서론에서 내용을 간단히 정리하고 본론으로 들어가보겠습니다.
--------------------------------------------------------------
0. 서론 & 간단 정리
DXY index (미 달러지수) 강세가 점점 심화되면서 글로벌 자금유동성 (Liquidity)는 계속 줄어들고 있습니다. BTC의 경우 이번주 최고 $19.6K / 최저 $18.3K 의 변동을 보였는데요, price action의 경우 지난 7월 저점 (19K 부근) 의 지지를 받아 간신히 버티고 있는 것으로 보입니다.
이번 주간 뉴스레터에서는 ① 결제 유틸리티 (Settlement Utility)/ ② 거래 참여도 (Retail Participation) / ③ 가상자산 채택 (Crypto Adoption) 등의 온체인 네트워크 상 활동 양상 (Activity Profile)을 통해 현 상황을 분석해보겠습니다.
---------------------------------------------------------------
39주자 결론 & 의견
1) BTC 하락세가 역대 최장 수준으로 길어지려 하고 있다.
2) 네트워크 유입은 가뭄 수준이고, 기존 코인 보유자들의 HODL 경향이 짙어지고 있다.
3) 현재 19-20K 가격대의 등락은 STH 집단에 의한 것이다. (LTH 집단은 HODL 스탠스를 취하고 있으니)
4) 지난 하락장과 비교해보면 바닥인 것 같기는 한데, 얼마나 더 길어질 지 모르겠다.
5) 문제는 19K 지지 뚫릴 경우, 11K 구간은 되어야 지지를 기대할 수 있다.
6) 따라서 항복 (공포에 의한 매도세) 이벤트가 또 발생하면서 추가 하락이 일어날 가능성을 열어두어야 한다.
→ 늘 긍정적인 시각의 소유자였던 글래스노드도 이제는 보수적으로 중립적인 시각을 내놓고 있습니다. 바닥으로 섣불리 판단하여 매수하기 보다, 조금 더 관망의 시간을 가져보는 것은 어떨까요?
--------------------------------------------------------------
I. All That Remains : 시장에 누가 남아있을까
● 요약 : 네트워크 신규 (객체) 유입량은 현재 3년 내 최저점을 기록하고 있습니다. 즉, 시장 참여율이 많이 줄어들었단 뜻이지만 2018년 약세장에 비하면 아직 높은 수준이긴 합니다.
첫번째로 확인할 지표 🟠는 “New Entities Metric” 입니다. 이 지표는 네트워크 유입 정도 (Network Adoption) 를 가늠하는 척도입니다. “Adoption”은 번역하면 “입양, 채택” 이지만 매끄럽게 의역하면 네트워크 채택을 통한 유입 → “네트워크 유입도”로 볼 수 있겠군요. 또한 “Entity”의 본래 뜻은 “독립체”를 의미하지만 BTC 네트워크의 Entity는 “개개의 비트코인 소유 객체”로 간주할 수 있습니다.
유의하실 점은, Entity는 지갑의 수를 나타내는 지표가 아니란 사실입니다. New entity는 네트워크 상 거래에 새로 등장한 객체 수를 의미하므로 신규 유입 사용자 수 정도로 보시면 될 것 같습니다.
해당 지표를 7일 이동평균선 (7DMA)로 그려보면, 최근 신규 유입 수준은 일일 8.35만 개 정도인데, 2020~21년 수준에 비하면 대폭 감소한 상황입니다. 2018년 하락장 최저치인 일일 6.65만 보다는 아직 높은 수준을 유지하고 있습니다.
● 요약 : 월간 이평선 / 연간 이평선 기준으로 볼 때에도 신규 유입 수준이 좋지 않아 근 시일 내 BTC 회복을 기대하긴 어려울 것 같습니다.
New entity가 어떤 의미인지 알았으니, 이번에는 월간 이동평균 🔴 과 연간 인동평균 🔵 을 비교하여 거시적으로 어떤 모멘텀 변화가 일어나는지 살펴봅시다.
1) 월간 증가율 🔴 > 연간 증가율 🔵 인 경우 (골든 크로스)
장기적으로 네트워크 유입세가 증가하면서 BTC 회복 추세가 이어질 것으로 예상할 수 있습니다.
2) 연간 증가율 🔵 > 월간 증가율 🔴 인 경우 (데드 크로스)
장기적으로 네트워크 유입세가 감소하면서 BTC 추세 악화로 이어질 것으로 예상할 수 있습니다.
보시면 🔴 (월간) 수치가 🔵 (연간) 수치보다 낮아진 지 약 1년 반 (530일 가량) 정도 되었습니다. 물론 중간에 50일 정도 (2022년 3-4월) 골든 크로스를 보일 때가 있긴 했지만 아주 잠깐이었습니다.
그래프 좌측은 2018~20년도 약세장 시기를 나타내는데, 골든 크로스 구간이 중간 중간 확인되는군요. 특히 2019년 중반에는 $ 6K에서 $ 14K 까지 상승 회복된 것이 흥미롭습니다.
일단 현재 데드크로스 상황이 계속되는 지금, 월간 유입도 🔴 감소 정도가 2021년 5월 최저점 (채굴자 대규모 이동 시기) 정도로 내려와 있는 상태입니다. 아직은 네트워크 신규 유입 수준이 낮으니 BTC 가격 회복을 기대하긴 힘든 상황으로 봐야겠습니다.
● 요약 : 당장 상승세로 전환하는 것은 아니지만, 소액 투자자들이 빠져나가면서 BTC 바닥을 다지는 안정기에 돌입한 것으로 보입니다.
이번 그래프는 “Median Transaction Volume metric” 으로 거래량 중앙값을 나타내는 값입니다.
평균이 전체 거래 금액의 합을 객체 수로 나눈 개념이라면 중앙값은 집단에 속하는 수 (개개의 거래량)를 크기 순으로 쭉 나열하였을 때 가운데 순번에 위치하는 값을 의미합니다. 평균 개념은, 극단적으로 크거나 작은 값이 데이터에 들어있을 경우 전체 평균이 달라지는 오류가 생길 수 있기 때문에 중앙값을 사용하곤 합니다.
위 그래프에서는, 극단적으로 큰 거래량을 보이는 “고래” 집단을 제외한 소액 규모 투자자들, 즉 소매 거래 (Retail)의 참여도를 확인할 수 있습니다.
1)🟢 지표가 증가하는 경우
소액 투자자 참여도가 증가함을 의미
2)🔴 지표가 감소하는 경우
소액 투자자 참여도가 감소함을 의미
3)🟠 지표가 감소 후 횡보 (평형 유지) 하는 경우
소액 투자자 들이 시장에서 빠져나가고 (expulsion : 퇴출), HODLer, 전문 트레이더, 고래 집단만이 남아있는 상황을 의미합니다.
현재 상황은 (3) 국면 진입 초기 단계로 보입니다. 시장의 소규모 거래 참여자들이 빠져나가면서 상대적 안정 단계 (바닥 다지기)로 돌입할 것으로 예측됩니다.
자, New Entities 지표에서 다루었던 것처럼 거래량 중앙값도 월간 🔴 / 연간 🔵 이평선으로 추세를 확인해보겠습니다.
1) 월간 증가율 🔴 > 연간 증가율 🔵 인 경우 (골든 크로스)
소규모 투자자 (Retail) 참여도 증가 추세를 의미
2) 연간 증가율 🔵 > 월간 증가율 🔴 인 경우 (데드 크로스)
소규모 투자자 (Retail) 참여도 감소 추세를 의미
사실 Median Transfer Volume이 줄어드는 것은, 소액 개인 투자자들이 시장에서 “숙청” 당하는 과정이라 할 수 있습니다.
2018년 약세장의 (좌측 회색영역) 경우 데드 크로스가 지속된 시기가 474일 가량으로 이후 골든 크로스가 나타나면서 시장이 회복세로 돌아섰습니다.
이는 현재 채굴자 대규모 이탈 사건 이후 426일 간 지속되는 상황과 그 기간과 양상이 유사하므로 조만간 골든 크로스를 보이며 회복세를 보이지 않을까 기대가 됩니다.
● 요약 : 채굴자 수수료 관련 지표도 전망이 좋지 않습니다. 네트워크 관련 수요가 감소한 상태인데, 바닥의 시작일지 끝일지 알 수가 없습니다.
마지막으로, 채굴자 수수료 수익을 통해 네트워크 활동 상황을 판단해보겠습니다. 위는 Miner Revenue (Fee : 수수료) 수준을 4년 치 기간 기준 범위내에서 (4yr rolling) Z-score (표준편차 환산 점수) 로 나타낸 것입니다.
1) 🔴 - Fee가 높게 유지되는 경우
Block space에 대한 지속적인 수요가 있다는 뜻으로, 네트워크 사용량 증가와 더불어 수요 확장의 긍정적 전망을 나타냅니다.
2) 🔵 - Fee가 낮게 유지되는 경우
반대로, 수요가 줄어들어 네트워크 참여도 (수요)가 감소하는 다소 부정적 전망을 나타냅니다.
일단 2021년 7월 이후, 계속 Low fee 상태가 유지되고 있으며 수요 측면에서 회복이 아직 일어나지 않았음을 의미합니다.
네트워크 활동 측면에서 참여율이 감소하므로 불모지처럼 황량해지는 것에 더해, 소액 개인 투자자들의 이탈과 New Entities 저점 상태를 고려하면 지표 상황이 좋지 않은 상황이군요.
II. A Full Detox : 완전한 해독 과정
이번에는 네트워크 상 파괴된 (Destroyed : 소비된) 코인의 수명 (lifespan) 의 규모를 알아보도록 하겠습니다.
위 “Spent Volume Age Bands” 지표는 장기 코인 보유자들이 하락 우려로 확신(conviction)을 잃고 코인을 지출하는지 여부를 평가합니다. 온체인 상 코인 전송량을 토대로 판단하지요.
해당 지표는 6개월 이상 오래 보유 되었던 코인을 대상으로 합니다. 어두운 주황색🟠 ~ 보라색 🟣으로 표시된 부분이 volume을 나타내는 것인데, 높이 자체는 전체 volume 을, 해당 수치 내부의 미묘한 색 차이 (예 : 주황색에 가까울 수록 6개월 보유, 진한색일 수록 장기 보유)는 보유 기간 별로 나누어 표시된 것이라 생각하시면 되겠습니다.
장기 투자자들에게서 주로 보이는 “스마트 머니 : Smart Money)”의 전체 거래량 내 차지하는 비율을, 단기 투자자들의 “새롭지만 미숙한 돈 (New & Inexperienced Money)” 와 비교하는 지표로 보시면 되겠습니다.
6개월 이상 보유 되었던 Old 코인 소비 추세는 2021년 1월 상승장 절정이던 때 전체 거래량 8%를 차지하였던 것과 달리, 현재는 0.4%에 불과할 정도로 크게 하락했습니다.
이는, 이전 상승장 말 (2021)에는 수익 실현을 위해 장기 코인 보유자들이 대량으로 코인 소비를 했다는 의미이며 현재는 반대로 다시 상승장이 올 것이라는 확신 하, 보유 포지션을 계속 유지하는 중으로 해석됩니다.
상승장에 대한 기대 심리가 남아있다는 뜻이니 자칫 긍정적인 신호로 보일 수 있습니다만, 사실 Chapter I 에서 언급한 “부진한 수요 및 불투명한 전망”을 감안한다면 앞으로 닥쳐올 하락 및 보합장을 대비해 HODLer 집단이 코인을 우선 묻어두려 한다고 보는 것이 타당할 것 같습니다.
● 요약 : 실현가 총액(Realized Capitalization) 측면에서 보면, Young 코인 규모가 최저치를 기록하고 있습니다. 이는 반대로 Mature 코인 규모가 늘어났다는 의미이며 장기 보유 추세가 짙어지는 것으로 보입니다.
코인을 단기 (Young) vs 장기 (Mature) 기준으로 이분화 한다면, Mature 코인 자산 규모가 증가하면 Young 코인 규모는 당연히 그에 맞게 줄어들게 됩니다.
위 지표의 주황색 🟠 영역은 3개월 이하 Young 코인이 전체 Realized Capitalization (실현가격 총액) 에서 몇 %를 차지하는지 보여주고 있습니다.
전체 총액 중 13.8% 가량으로 현재 많이 떨어진 상태인데요, 장기 보유 코인 (Mature coin)의 지출 경향이 줄어들면서 HODLing 추세가 심화되어 나타난 것으로 보입니다.
현재 투자자들 대부분이 코인을 지출하지 않으려 하기 때문에 Mature 코인 자산 규모는 사상 최대치를 기록하고 있습니다. 이는 반대로 Young 코인 자산 규모가 매우 줄어들었다는 뜻인데요, 현재 시장에서 나타나는 거래 활동이 Young 코인 집단에 의해 일어나고 있음을 감안한다면, Young 코인 규모 감소에 따른 유동성 공급 축소가 나타날 수 있습니다.
● 요약 : CDD-90 (장기보유자 코인 지출 경향) 역시 역대 최저치로, BTC 시장 내 HODL 경향이 최고조에 달한 것으로 보입니다.
장기 보유자들의 코인 지출 경향 파악엔 CDD (Coin Days Destroyed)지표를 활용할 수 있습니다. CDD는 장기 보유 코인이 거래되었을 때 상승하는 지표이며 오랫동안 보유된 것일수록 가중치가 높아집니다. CDD는 이동한 코인 개수와 해당 코인이 마지막으로 소비되었던 기간 (days)를 곱해 합산하여 산출합니다.
“Entity-Adjusted 90-day Coin Days Destroyed (CDD-90)” 지표는 90일 이상 보유되었던 코인의 CDD 를 나타낸 것으로, 3달 이상 보유한 장기 코인이 시장에서 지출되는 추세인지, 보유 추세인지 여부를 알려줍니다.
현재 CDD-90은 역대 최저 수준으로 감소하였는데, 장기 보유 코인이 사실상 휴면 상태처럼 더 이상 거래되지 않음을 의미합니다. 이는 현재 BTC 시장의 HODL 경향이 매우 크다는 것을 의미합니다.
● 요약 : 장기 보유 추세로 인해 BTC의 Active supply 역시 잘 일어나지 않고 있습니다.
“Revived Supply 1+ Years Z-score”지표는 휴면 상태의 코인 (잠재적 공급으로 간주 : Latent Supply)이 다시금 거래되면서 “공급 활성화” 로 이어지는 지를 보여줍니다. 현재 Z-score는 “0”으로 수렴하는 중인데 , 보유 경향 확대로 인해 공급 활성화가 부진한 상황을 나타내고 있습니다.
1) 표준편차 2 시그마 이상인 경우 🔵
대규모 공급이 이어지고 있음을 의미합니다.
2) 표준편차 2 시그마 이하인 경우 🟠
보유 → 거래로 이어지는 잠재적 공급량이 낮은 상태임을 의미합니다.
따라서 현재 (2) 상황에 해당하고, 장기 보유 코인의 지출 경향이 큰 폭으로 줄어들면서 Latent supply가 Active supply로 이어지지 않는 상황인 것으로 보입니다.
● 요약 : BTC의 크나큰 변동성을 경험했던 장기 투자자들은, 이번 하락장에서 “HODL” 하는 것으로 대응하고 있습니다. 변동 스펙트럼이 워낙 넓으니 언젠가 다시 수익 실현할 정도로 상승할 것이라는 심리 때문인 것 같군요.
이번에 위 지표를 2018년도 까지 확장해서 살펴보겠습니다. 상승장에서 회복된 공급량 (Revived Supply)이 약세장과 명확한 차이를 보임을 알 수 있습니다.
① 2020년 상승장에서 $20K 돌파하였을 때
Mature 코인들이 이익 실현을 위해 대규모로 소비되면서 시장에 대량으로 공급되었습니다. 이후 40K 까지 치솟으면서 Z-score는 +13.5 가량으로 최대치를 기록했습니다. 공급이 과잉 상태였다는 신호였고 이후 보합세 → 하락장으로 지금까지 이어지게 되었습니다. 이는 2018년 경 +14 편차를 기록한 이후 하락세가 이어진 것과 유사합니다.
②2022년 하락세로 인해 다시 $20K로 회귀한 현재
현재는 20K 수준으로 하락하게 되었고, 시장 반응은 2020년 상승장과는 정 반대 상황입니다. Mature 코인의 지출 경향은 2018년 약세장 만큼이나 줄어들어 조용한 상황입니다.
2018~2022의 상승/하락을 경험했던 장기 보유자들은, BTC의 변동성이 워낙 큰 것을 경험했기 때문에 현재 가격 수준에서 매도할 생각조차 하지 않는 것으로 보입니다. 따라서 일단 가격이 상승할 것이라 생각하고 현재 하락 추세가 얼마나 이어지든 HODL 포지션을 고수하는 것이겠지요.
III. A Short-Term Holders Market : 단기 보유자들의 상태는?
● 요약 : 현재 19-20K와 11-12K 사이를 지지해줄 STH, LTH 집단이 없기 때문에 최악의 경우 11K 까지 하락 가능성을 열어두어야 합니다.
코인 보유 기간에 따라 투자자들 집단을 장기 보유자 (LTH) 🔵 와 단기 보유자 (STH) 🔴 로 나눌 수 있습니다. 이 때 특징적으로 관찰되는 3가지 사항이 있는데요,
① 30K 이상 가격대에서 매집 되었던 코인들은 LTH 추세 🔵 (155일 이상 보유)로 전환된 것으로 보입니다. 가격이 많이 하락하여 손실을 보면서 매도할 수는 없었기에 장기 보유키로 생각했기 때문이겠지요.
② 현재 BTC의 가격 변동은, STH 집단 🔴이 적절한 저점을 노리고 있기 때문인 것으로 생각됩니다. 최근 항복 (capitulation)으로 인한 대량 매도세와 수요 유입 모두 단기 투자자들에 의해 일어난 것으로 볼 수 있겠군요.
③ 주황색 영역 (🟠) 을 잘 보시면, $ 11~12K 구간에 해당되는 STH, LTH 집단이 존재하지 않는다는 점이 문제인데, 만약 현재 가격대 지지 실패가 일어난다면 11K 구간까지 하락할 가능성이 있습니다. 19K 지지선이 깨지면 STH 집단은 엄청난 손실을 입게 될 것이며, 결국 하방 지지 약화에 따른 추가 하락 공포로 항복 (Capitulation) 이벤트가 발생할 수 있습니다.
LTH 집단은 최근 몇달 사이의 등락에 크게 동요하지는 않은 것으로 조입니다. 대조적으로, STH 집단이 현재 price action을 좌지우지하는 상황입니다.
● 요약 : STH 집단이 수익을 보고 있는지 여부를 들여다보면, 아직까지는 “압축” 구간입니다. 하지만, 역대급으로 하락장 기간이 길었기 때문에 곧 “확장” 구간으로 전환할 지도 모르겠습니다.
STH 집단의 소비 패턴을 이해하기 위해, 사이클에 걸친 STH 집단 수익성 정도 (Total Supply in Profit)를 분석해보겠습니다.
Phase 1: 붕괴 🔴 : 사이클 고점 달성 후, Price action이 급격히 붕괴하면서 STH 집단이 큰 손실을 입는 구간입니다.
Phase 2: 압축 🟡 : 가격이 하락하면서 STH 집단이 수익을 보는 경우도 줄어들게 됩니다. 대부분의 STH 투자자들은 손실을 보게 됩니다.
Phase 3: 확장 🟢 : STH 집단의 cost basis가 시장 가격 수준과 유사하게 수렴한 상태입니다. 시장이 상승 랠리를 이어가면서 미실현 이익이 증가하게 되고, STH 집단은 “조금 더 가지고 있으면 더욱 오르지 않을까?” 하는 심리에 HODL 경향을 조금씩 보이게 됩니다.
현재 상황은 Phase 2 🟡 구간이며, 431 일 가량으로 길게 지속되었습니다. 이는 하락장 사이클 중 제일 긴 기간이기도 합니다.
---------------------------------------------------
IV. Summary : 요약 및 결론
현재 네트워크 활동 수준, 특히 네트워크 유입 정도는 코로나 시기 이후 최저 상태로 심각한 상황입니다. 그나마 긍정적인 관점으로 본다면, 단기간 투기 목적으로 참여했던 소액 투자자 집단이 시장에서 퇴출 되면서, HODLer, 전문 트레이더, 장기 BTC 보유자 집단만이 남게 될 것이라는 점입니다. 즉, BTC 네트워크 생태계가 초반 기초 단계로 다시 되돌아가고 있음을 의미합니다.
현 하락장에 있어 HODLer 집단의 반응은 다소 단호한 편입니다. 여러 코인 수명과 관련된 지표들을 보면, 보유 코인을 지출하지 않겠다는 경향이 점차 심해져 왔고 현재 역대 최저 수준을 보이고 있습니다. 따라서 현재 BTC 가격 변동은 STH (단기 보유자) 들에 의해 일어나는 상황입니다.
투기 경향이 짙었던 STH 세력은 이제 거의 사라진 것으로 보이며, STH 집단 cost-basis 역시 현재 시장 가치 수준으로 되돌아온 상황입니다.
다만, 현재 가격대에 공급 자체가 집중되어 있는 상황으로, 지난 6월 17.5K 저점 하방 돌파 시 항복에 의한 추가 급락 가능성이 있습니다.
-----------------코멘트--------------------
BTC 하락장이 길어지면서 바닥이다, 바닥이다 외쳐왔지만 그 누구도 현재가 바닥의 초입일지 마지막일지 알 수 없습니다. 글래스노드 레포트도 지난 4주간 긍정적인 메세지를 던져왔지만 이제는 보수적인 의견을 내놓고 있군요.
위에서 볼 수 있듯, STH 투자자들의 이탈 및 잔존 투자자들의 장기 보유 경향으로 바닥 자체가 단단히 다져지는 중인 것은 사실입니다. 어제인 9월 26일 부터 나타난 반등 역시 바닥에서 상승장으로 전환되는 신호탄일 수 있지요.
하지만 일시적 베어마켓 랠리일 수 있으며, 현재 19-20K 수준에 소위 매물이 몰려 있기 때문에 추가 하락이 나타난다면 공포심으로 “던지는” 투자자들이 다시 생길 수 있습니다. 특히 11K-12K 수준으로 내려가야 탄탄한 지지층을 기대할 수 있기 때문에 최악의 경우 11K 까지도 열어두어야 합니다.
따라서 현재 BTC를 바닥이라 판단 후 성급히 매수하시기 보다, 조금 더 상황을 관망하심이 현명할 것으로 생각됩니다.
긴 글 읽어주셔서 감사합니다 :)

dYdX 코인 차트 전망 | 디파이 코인 종류 - 중국발 규제는 오히려 호재? 디파이에 투자하는 법안녕하세요 1PERCENT 입니다.
지난 24일 중국이 가상화폐 관련 모든 활동을 금지하면서
디파이(DeFi)와 덱스(DEX)에 관심이 쏠리고 있습니다. 중국의 고강도 규제가 본격화되면서 수조원의 중국 자금이 탈중앙화 거래소인 dYdX로 몰리며 일거래량이 11조에 육박했습니다. 국내 최대 거래소 업비트의 3배를 넘는 규모입니다.
dYdX 거래소의 토큰인 DYDX 코인은 중국 규제를 수혜로 9월 13일 저점에서 29일까지 +208%라는 어마무시한 상승을 보였습니다. 오늘은 간단히 디파이와 덱스가 무엇인지 그리고 차팅을 통해 디파이 전망을 분석해 보도록 하겠습니다.
"DEFI? DEX?"
Defi는 Decentralized Finance의 약자로, 직역하면 '분산금융'입니다.
디파이는 중개기관 없는 금융서비스로 이용자들이 계속해서 늘고 있는 추세입니다.
기존 금융 서비스들을 이용하기 위해서는 본인인증을 시작으로 서류작업 등 다소 복잡한 과정들을 거쳐야만 했습니다.
하지만 디파이를 통해 본인 확인 절차도 필요없고 모든 금융서비스를 몇번의 클릭만으로 이용할 수 있습니다.
송금, 결제, 금융상품 등 기존 금융기관에서 제공하는 서비스들을 블록체인의 스마트 컨트랙트*를 통해 자동화시켜 중개자가 필요가 없습니다.
*스마트 컨트랙트 (smart contract) : 서면으로 이루어지던 계약을 블로체인에 구현하고 특정 조건이 충족되었을 때 해당 계약이 이행되게 하는 스크립트입니다.
디파이의 중심에는 탈중앙화 암호화폐 거래소 덱스(DEX)가 있습니다.
덱스는 (Decentralized exchange)의 약자로 직역하면 '탈중앙화 거래소'입니다.
바이낸스, FTX, 업빗 등 중앙화된 암호화폐 거래소와 달리 제 3자 없이 P2P방식으로 운영되는 암호화폐 거래소를 말합니다.
중개기관이 없기에 중국 자본이 중국의 규제망을 피해서 덱스들로 옮겨진 것이죠.
덱스의 가장 큰 장점은 거래소에 자금을 맡길 필요가 없고 다수의 거래소들이 요구하는 본인인증을 할 필요가 없습니다.
그외 장단점들은 프로젝트마다 다릅니다.
이더리움 기반 덱스들은 높은 수수료와 확장성 문제가 큰 반면 다른 프로젝트들은 물량 문제 때문에 거래가 제대로 성사가 안되는 경우도 많습니다. 이 모든게 이전 포스팅에서 다뤘던 블록체인 트릴레마랑 연관이 있음으로 앞으로 블록체인 프로젝트들이 풀어나가야할 숙제입니다.
디파이 토큰들의 차트를 함께 보시겠습니다.
https://www.tradingview.com/x/Tb5ms679/
Defi-Perp는 주식이랑 비교를 하시면 25개의 DeFi 코인들을 묶어둔 ETF라고 보시면 됩니다.
25개의 코인들을 포함하고 있기 때문에 특정 프로젝트의 악재로 인한 하락에서 지켜줄 수 있는 비교적 안전한 상품이라고 볼 수 있습니다.
디파이에 투자를 하고 싶으시지만 어느 프로젝트에 투자할 줄 모르시는 분들은 FTX에 가입하셔서 Defi-Perp를 거래하시면 됩니다.
Defi-Perp는 5파 상승 이후 3파 조정을 마친 상태입니다.
현재 8월 레인지 중앙선에서 지지를 받고 있는 모습이며 8월 레인지 상단까지 상승할 확률이 높아보입니다.
8월 레인지 중앙선을 잃을 경우 8월 레인지 하단까지 하락할 가능성이 높아지니 8월 레인지 중앙선을 기억하시고 트레이딩을 하시면 되시겠습니다.
다음은 메인 차트인 dYdX 차트를 살피겠습니다.
9월 13일 부터 2주만에 +208%라는 무서운 상승세를 보이고 있는 코인입니다.
흰색 채널 상단을 지킬 수만 있다면 상승세는 유효하며 순차적 피보나치 타겟 이후 최종 목표가는 $43.205입니다.
채널 상단을 잃을 경우 주요 지지선은 월요일 레인지 그리고 채널 하단이 되겠습니다.
기업이든 코인이든 투자하시기 전에는 항상 충분한 공부를 통해 가치를 분석하셔야합니다.
디파이는 엄청난 잠재력이 있지만 여전히 풀어야할 과제들이 많습니다.
마치며...
"유튜브가 처음 등장했을 때, 훗날 대형 미디어에 이토록 위협이 되리라고 예상한 사람은 거의 없었다.지금은 어떤가? 과거 정부 인허가에 의존해 성장해온 레거시 미디어는 탈중앙화 소셜미디어의 위력 앞에 생존을 위협받고 있다. 자유로운 개인들이 저비용으로 방송을 송출하고 공유하며, 전통 미디어에서 상상할 수 없었던 다채로운 콘텐츠가 폭발하고 있다. 무분별한 규제가 개입하지 않는 한, 앞으로 금융에서도 이런 일이 일어나지 않는다는 법이 있을까?"
송경모 < 고려대 기술경영전문대학원 겸임교수 >
감사합니다,
1PERCENT

ICO MERCHANT TOKEN (BEST ICO 2021)HIPS Merchant Protocol ( HMP ), Hips Merchant Protocol Gateway (HMP-gateway) and Merchant Token ( MTO ) is a solution that introduces consumer protection concepts from the traditional card payment industry to any blockchain with support for smart contracts such as Ethereum , Cardano (ADA) or Solana.
"We believe that the consumer-oriented features of the MTO are the missing piece for crypto payments to have market penetration and mass adoption among mainstream consumers," says John Cavebring, CEO of Hips.
Merchant Token ( MTO ) is the native protocol token of the Hips Merchant Protocol ( HMP ), currently issued on Ethereum following the ERC-20 standard. HMP will hold the ERC20 tokens on the Ethereum blockchain as a start, but the protocol will work similarly on other supported blockchains like Cardano, among others.
“HIPS Merchant Blockchain is the native blockchain for HMP and Merchant Coin (MEO), which is the native block currency in Hips Merchant Blockchain, and is optimized for real-time business transactions created for Payment Service Providers (PSP) and EFTPOS devices, ”added Cavebring.
A widely adopted and fully on-chain Merchant Payment Protocol would need to have comparable transaction performance, such as US exchanges, such as the NYSE, of an underlying blockchain in order to scale.
“The near real-time transaction speeds of the HIPS Merchant Blockchain are a huge improvement to the current blockchain response. Hips Merchant Protocol is not only designed for Ethereum , but also on Solana, an incredibly fast public blockchain that can support more than 50,000 transactions per second, has lock times of 400 milliseconds, and a transaction cost of approximately $ 0.00001 ”, Cavebring points out.
With near-real-time transaction speeds, plus the Hips Merchant Blockchain is designed for business transactions regardless of whether they are mobile, in-store, or e-commerce, and utilizes the payment card industry exchange concept, HIPS provides a solution for crypto payments to be obtained worldwide. global consumer adoption.
